Hmong vs Immigrants from Vietnam Median Family Income
COMPARE
Hmong
Immigrants from Vietnam
Median Family Income
Median Family Income Comparison
Hmong
Immigrants from Vietnam
$91,296
MEDIAN FAMILY INCOME
0.3/ 100
METRIC RATING
265th/ 347
METRIC RANK
$106,186
MEDIAN FAMILY INCOME
85.7/ 100
METRIC RATING
138th/ 347
METRIC RANK
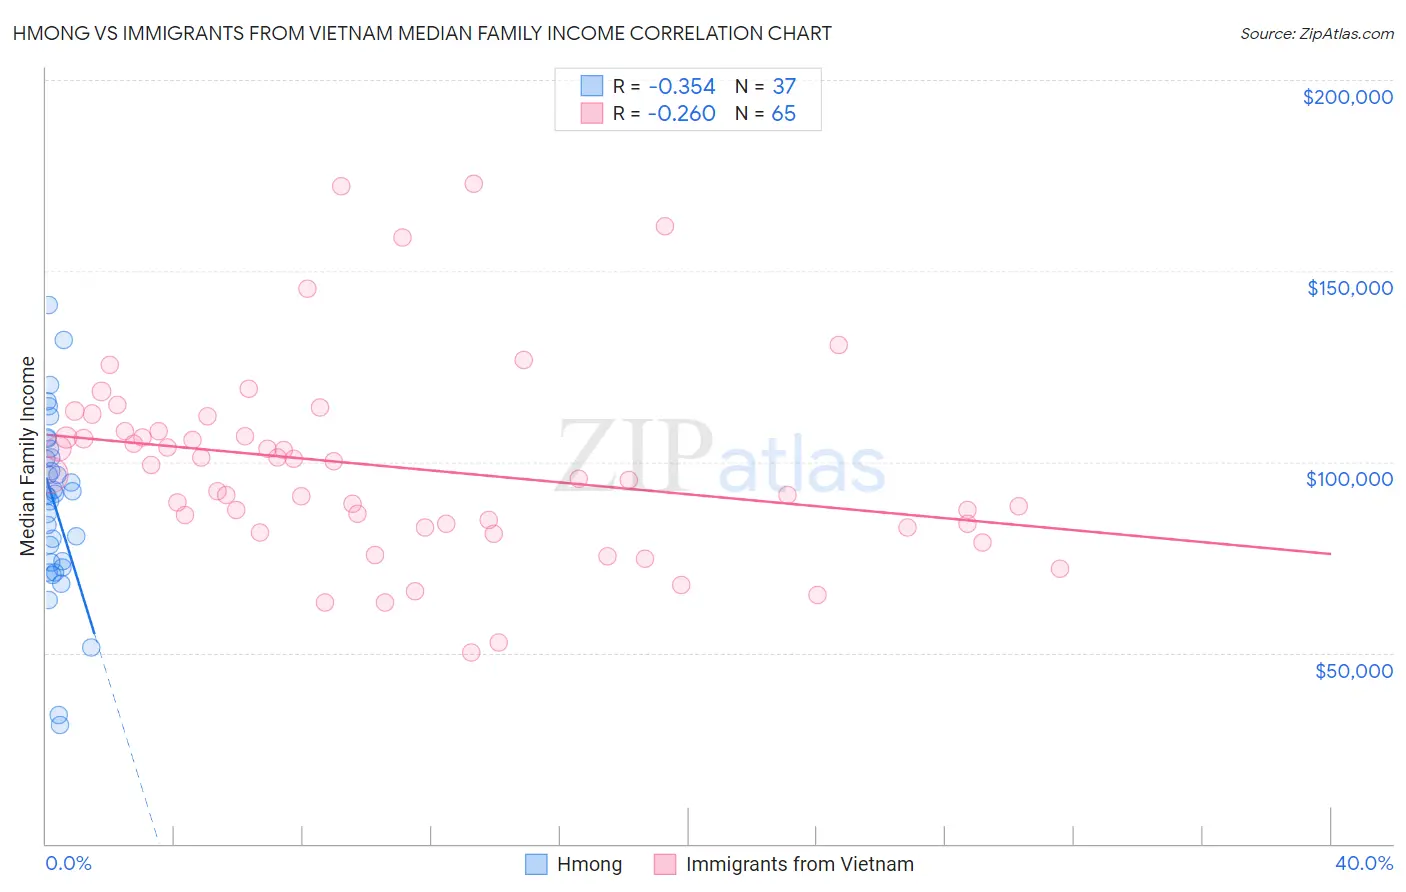
Hmong vs Immigrants from Vietnam Median Family Income Correlation Chart
The statistical analysis conducted on geographies consisting of 24,655,529 people shows a mild negative correlation between the proportion of Hmong and median family income in the United States with a correlation coefficient (R) of -0.354 and weighted average of $91,296. Similarly, the statistical analysis conducted on geographies consisting of 404,425,840 people shows a weak negative correlation between the proportion of Immigrants from Vietnam and median family income in the United States with a correlation coefficient (R) of -0.260 and weighted average of $106,186, a difference of 16.3%.
Median Family Income Correlation Summary
| Measurement | Hmong | Immigrants from Vietnam |
| Minimum | $31,056 | $50,204 |
| Maximum | $141,078 | $172,860 |
| Range | $110,022 | $122,656 |
| Mean | $88,552 | $98,743 |
| Median | $91,363 | $96,507 |
| Interquartile 25% (IQ1) | $73,027 | $83,286 |
| Interquartile 75% (IQ3) | $102,409 | $108,037 |
| Interquartile Range (IQR) | $29,382 | $24,751 |
| Standard Deviation (Sample) | $23,412 | $25,431 |
| Standard Deviation (Population) | $23,093 | $25,234 |
Similar Demographics by Median Family Income
Demographics Similar to Hmong by Median Family Income
In terms of median family income, the demographic groups most similar to Hmong are Senegalese ($91,475, a difference of 0.20%), Central American ($91,087, a difference of 0.23%), Immigrants from West Indies ($91,588, a difference of 0.32%), Mexican American Indian ($90,918, a difference of 0.42%), and Cree ($90,882, a difference of 0.46%).
| Demographics | Rating | Rank | Median Family Income |
| Osage | 0.4 /100 | #258 | Tragic $91,926 |
| Cape Verdeans | 0.4 /100 | #259 | Tragic $91,848 |
| Pennsylvania Germans | 0.4 /100 | #260 | Tragic $91,763 |
| Inupiat | 0.4 /100 | #261 | Tragic $91,730 |
| Liberians | 0.4 /100 | #262 | Tragic $91,722 |
| Immigrants | West Indies | 0.3 /100 | #263 | Tragic $91,588 |
| Senegalese | 0.3 /100 | #264 | Tragic $91,475 |
| Hmong | 0.3 /100 | #265 | Tragic $91,296 |
| Central Americans | 0.3 /100 | #266 | Tragic $91,087 |
| Mexican American Indians | 0.2 /100 | #267 | Tragic $90,918 |
| Cree | 0.2 /100 | #268 | Tragic $90,882 |
| Belizeans | 0.2 /100 | #269 | Tragic $90,880 |
| Jamaicans | 0.2 /100 | #270 | Tragic $90,581 |
| Iroquois | 0.2 /100 | #271 | Tragic $90,543 |
| Immigrants | Liberia | 0.2 /100 | #272 | Tragic $90,450 |
Demographics Similar to Immigrants from Vietnam by Median Family Income
In terms of median family income, the demographic groups most similar to Immigrants from Vietnam are Immigrants from Uganda ($106,188, a difference of 0.0%), Luxembourger ($106,183, a difference of 0.0%), Norwegian ($106,144, a difference of 0.040%), Immigrants from South Eastern Asia ($106,252, a difference of 0.060%), and Immigrants from Syria ($106,118, a difference of 0.060%).
| Demographics | Rating | Rank | Median Family Income |
| Canadians | 88.1 /100 | #131 | Excellent $106,597 |
| Immigrants | Fiji | 87.8 /100 | #132 | Excellent $106,544 |
| Ugandans | 87.8 /100 | #133 | Excellent $106,541 |
| Immigrants | Oceania | 87.3 /100 | #134 | Excellent $106,453 |
| Portuguese | 86.3 /100 | #135 | Excellent $106,286 |
| Immigrants | South Eastern Asia | 86.1 /100 | #136 | Excellent $106,252 |
| Immigrants | Uganda | 85.7 /100 | #137 | Excellent $106,188 |
| Immigrants | Vietnam | 85.7 /100 | #138 | Excellent $106,186 |
| Luxembourgers | 85.7 /100 | #139 | Excellent $106,183 |
| Norwegians | 85.5 /100 | #140 | Excellent $106,144 |
| Immigrants | Syria | 85.3 /100 | #141 | Excellent $106,118 |
| Slovenes | 84.7 /100 | #142 | Excellent $106,020 |
| Tongans | 84.3 /100 | #143 | Excellent $105,967 |
| Immigrants | Morocco | 84.3 /100 | #144 | Excellent $105,964 |
| Danes | 83.8 /100 | #145 | Excellent $105,900 |