Immigrants from Bangladesh vs Immigrants from Vietnam Median Family Income
COMPARE
Immigrants from Bangladesh
Immigrants from Vietnam
Median Family Income
Median Family Income Comparison
Immigrants from Bangladesh
Immigrants from Vietnam
$94,665
MEDIAN FAMILY INCOME
1.6/ 100
METRIC RATING
233rd/ 347
METRIC RANK
$106,186
MEDIAN FAMILY INCOME
85.7/ 100
METRIC RATING
138th/ 347
METRIC RANK
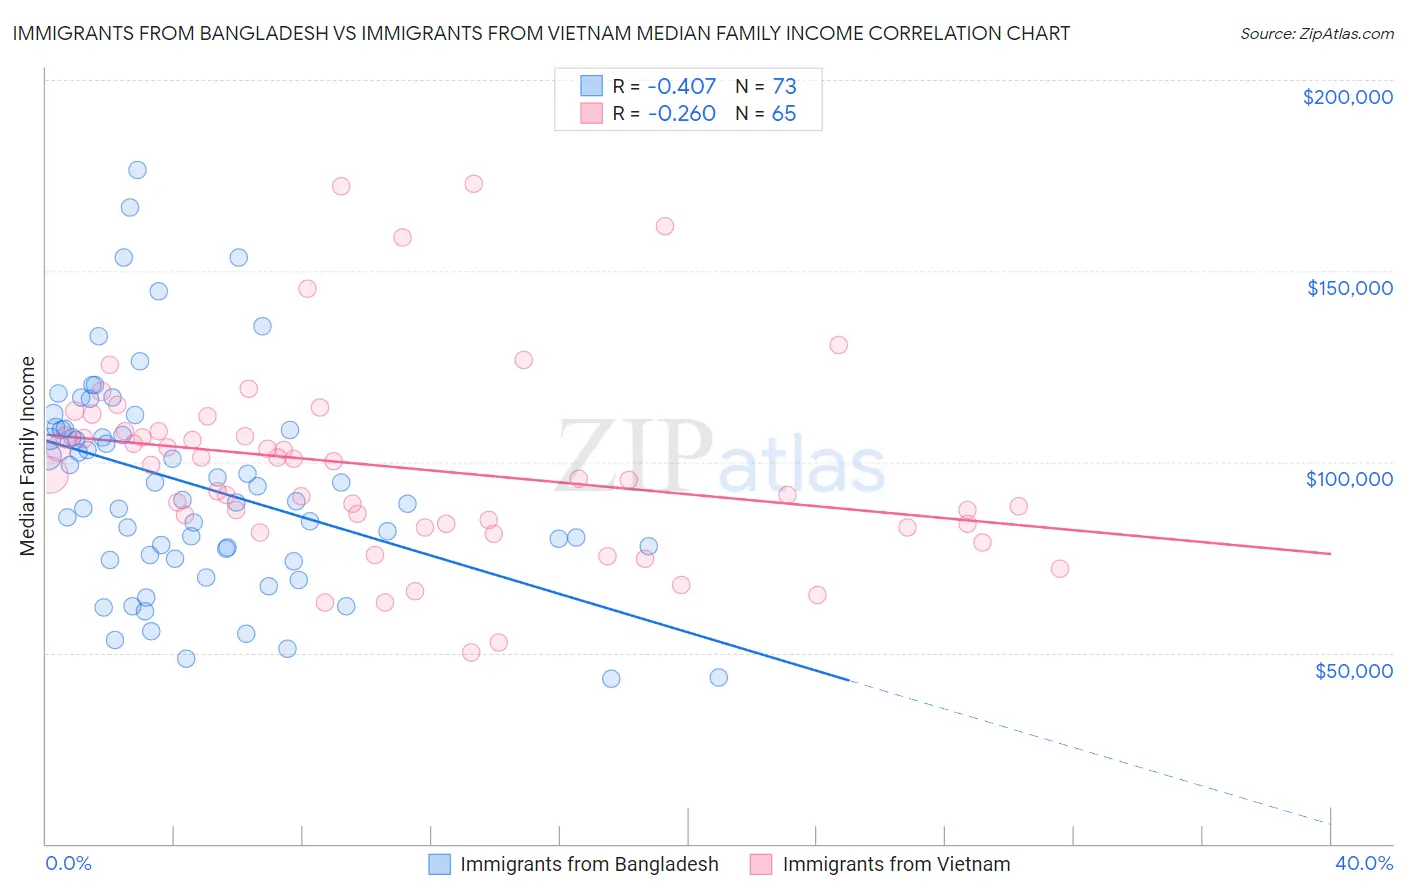
Immigrants from Bangladesh vs Immigrants from Vietnam Median Family Income Correlation Chart
The statistical analysis conducted on geographies consisting of 203,503,484 people shows a moderate negative correlation between the proportion of Immigrants from Bangladesh and median family income in the United States with a correlation coefficient (R) of -0.407 and weighted average of $94,665. Similarly, the statistical analysis conducted on geographies consisting of 404,425,840 people shows a weak negative correlation between the proportion of Immigrants from Vietnam and median family income in the United States with a correlation coefficient (R) of -0.260 and weighted average of $106,186, a difference of 12.2%.
Median Family Income Correlation Summary
| Measurement | Immigrants from Bangladesh | Immigrants from Vietnam |
| Minimum | $43,315 | $50,204 |
| Maximum | $176,322 | $172,860 |
| Range | $133,007 | $122,656 |
| Mean | $93,798 | $98,743 |
| Median | $90,050 | $96,507 |
| Interquartile 25% (IQ1) | $75,060 | $83,286 |
| Interquartile 75% (IQ3) | $108,612 | $108,037 |
| Interquartile Range (IQR) | $33,553 | $24,751 |
| Standard Deviation (Sample) | $28,054 | $25,431 |
| Standard Deviation (Population) | $27,861 | $25,234 |
Similar Demographics by Median Family Income
Demographics Similar to Immigrants from Bangladesh by Median Family Income
In terms of median family income, the demographic groups most similar to Immigrants from Bangladesh are Immigrants from Western Africa ($94,638, a difference of 0.030%), Immigrants from Burma/Myanmar ($94,472, a difference of 0.20%), Trinidadian and Tobagonian ($94,466, a difference of 0.21%), Immigrants from Venezuela ($94,904, a difference of 0.25%), and Alaskan Athabascan ($94,429, a difference of 0.25%).
| Demographics | Rating | Rank | Median Family Income |
| Immigrants | Panama | 2.7 /100 | #226 | Tragic $95,647 |
| Alaska Natives | 2.6 /100 | #227 | Tragic $95,573 |
| Immigrants | Azores | 2.4 /100 | #228 | Tragic $95,402 |
| Marshallese | 2.2 /100 | #229 | Tragic $95,293 |
| Malaysians | 2.2 /100 | #230 | Tragic $95,230 |
| Ecuadorians | 2.1 /100 | #231 | Tragic $95,114 |
| Immigrants | Venezuela | 1.9 /100 | #232 | Tragic $94,904 |
| Immigrants | Bangladesh | 1.6 /100 | #233 | Tragic $94,665 |
| Immigrants | Western Africa | 1.6 /100 | #234 | Tragic $94,638 |
| Immigrants | Burma/Myanmar | 1.5 /100 | #235 | Tragic $94,472 |
| Trinidadians and Tobagonians | 1.5 /100 | #236 | Tragic $94,466 |
| Alaskan Athabascans | 1.5 /100 | #237 | Tragic $94,429 |
| Nepalese | 1.3 /100 | #238 | Tragic $94,153 |
| Salvadorans | 1.2 /100 | #239 | Tragic $94,109 |
| Somalis | 1.2 /100 | #240 | Tragic $94,085 |
Demographics Similar to Immigrants from Vietnam by Median Family Income
In terms of median family income, the demographic groups most similar to Immigrants from Vietnam are Immigrants from Uganda ($106,188, a difference of 0.0%), Luxembourger ($106,183, a difference of 0.0%), Norwegian ($106,144, a difference of 0.040%), Immigrants from South Eastern Asia ($106,252, a difference of 0.060%), and Immigrants from Syria ($106,118, a difference of 0.060%).
| Demographics | Rating | Rank | Median Family Income |
| Canadians | 88.1 /100 | #131 | Excellent $106,597 |
| Immigrants | Fiji | 87.8 /100 | #132 | Excellent $106,544 |
| Ugandans | 87.8 /100 | #133 | Excellent $106,541 |
| Immigrants | Oceania | 87.3 /100 | #134 | Excellent $106,453 |
| Portuguese | 86.3 /100 | #135 | Excellent $106,286 |
| Immigrants | South Eastern Asia | 86.1 /100 | #136 | Excellent $106,252 |
| Immigrants | Uganda | 85.7 /100 | #137 | Excellent $106,188 |
| Immigrants | Vietnam | 85.7 /100 | #138 | Excellent $106,186 |
| Luxembourgers | 85.7 /100 | #139 | Excellent $106,183 |
| Norwegians | 85.5 /100 | #140 | Excellent $106,144 |
| Immigrants | Syria | 85.3 /100 | #141 | Excellent $106,118 |
| Slovenes | 84.7 /100 | #142 | Excellent $106,020 |
| Tongans | 84.3 /100 | #143 | Excellent $105,967 |
| Immigrants | Morocco | 84.3 /100 | #144 | Excellent $105,964 |
| Danes | 83.8 /100 | #145 | Excellent $105,900 |