Immigrants from Japan vs Crow Median Family Income
COMPARE
Immigrants from Japan
Crow
Median Family Income
Median Family Income Comparison
Immigrants from Japan
Crow
$122,764
MEDIAN FAMILY INCOME
100.0/ 100
METRIC RATING
23rd/ 347
METRIC RANK
$76,605
MEDIAN FAMILY INCOME
0.0/ 100
METRIC RATING
342nd/ 347
METRIC RANK
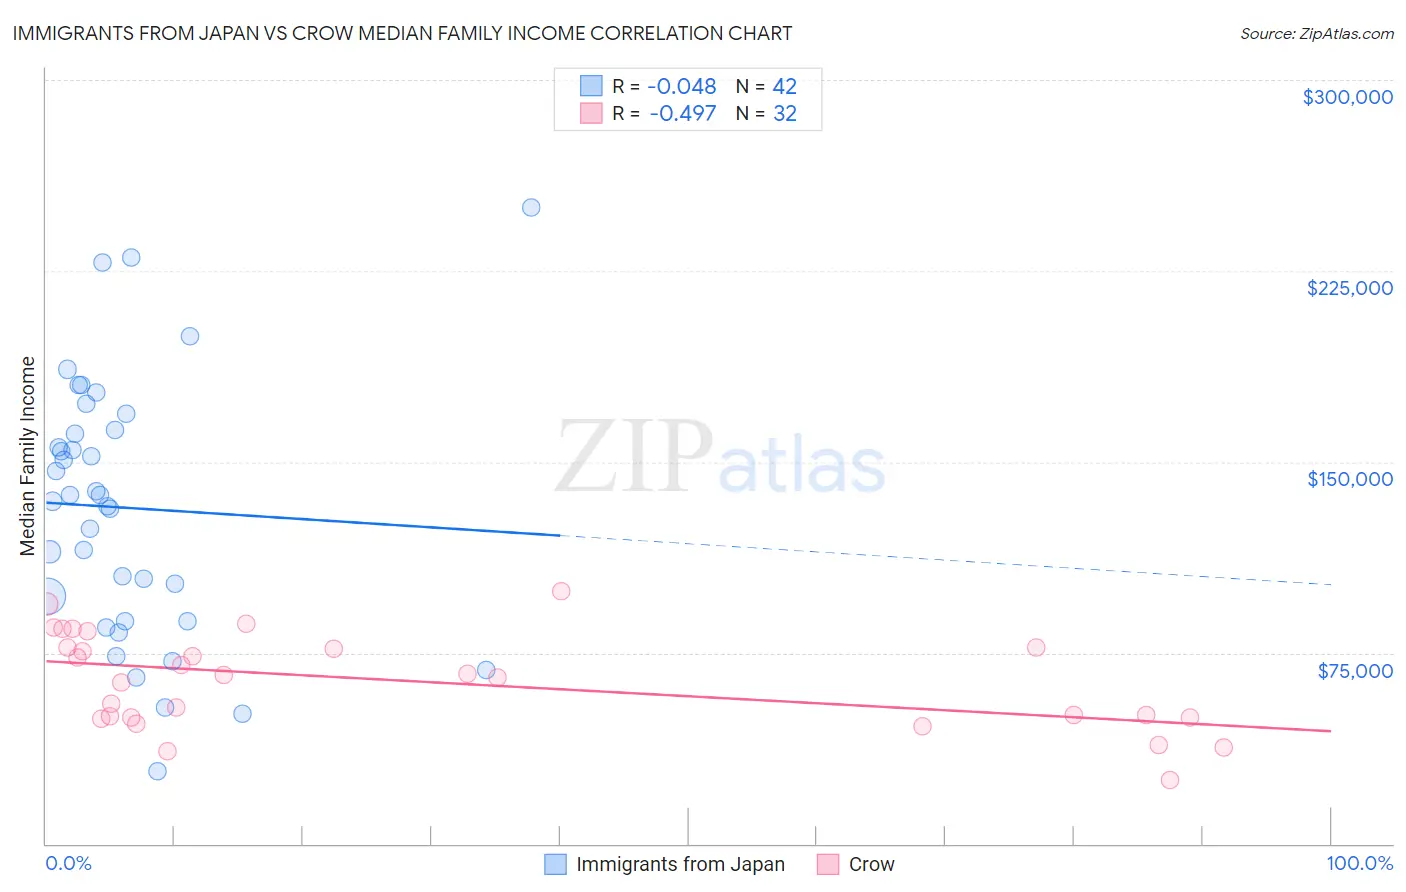
Immigrants from Japan vs Crow Median Family Income Correlation Chart
The statistical analysis conducted on geographies consisting of 339,915,551 people shows no correlation between the proportion of Immigrants from Japan and median family income in the United States with a correlation coefficient (R) of -0.048 and weighted average of $122,764. Similarly, the statistical analysis conducted on geographies consisting of 59,195,543 people shows a moderate negative correlation between the proportion of Crow and median family income in the United States with a correlation coefficient (R) of -0.497 and weighted average of $76,605, a difference of 60.3%.
Median Family Income Correlation Summary
| Measurement | Immigrants from Japan | Crow |
| Minimum | $28,538 | $25,179 |
| Maximum | $250,001 | $99,219 |
| Range | $221,463 | $74,040 |
| Mean | $131,921 | $63,807 |
| Median | $135,669 | $65,747 |
| Interquartile 25% (IQ1) | $87,578 | $49,683 |
| Interquartile 75% (IQ3) | $162,396 | $77,098 |
| Interquartile Range (IQR) | $74,818 | $27,414 |
| Standard Deviation (Sample) | $50,889 | $18,632 |
| Standard Deviation (Population) | $50,280 | $18,339 |
Similar Demographics by Median Family Income
Demographics Similar to Immigrants from Japan by Median Family Income
In terms of median family income, the demographic groups most similar to Immigrants from Japan are Immigrants from Sweden ($122,765, a difference of 0.0%), Immigrants from Korea ($122,800, a difference of 0.030%), Burmese ($123,369, a difference of 0.49%), Immigrants from Northern Europe ($121,840, a difference of 0.76%), and Immigrants from Belgium ($123,831, a difference of 0.87%).
| Demographics | Rating | Rank | Median Family Income |
| Immigrants | China | 100.0 /100 | #16 | Exceptional $125,540 |
| Indians (Asian) | 100.0 /100 | #17 | Exceptional $125,312 |
| Immigrants | Eastern Asia | 100.0 /100 | #18 | Exceptional $125,150 |
| Immigrants | Belgium | 100.0 /100 | #19 | Exceptional $123,831 |
| Burmese | 100.0 /100 | #20 | Exceptional $123,369 |
| Immigrants | Korea | 100.0 /100 | #21 | Exceptional $122,800 |
| Immigrants | Sweden | 100.0 /100 | #22 | Exceptional $122,765 |
| Immigrants | Japan | 100.0 /100 | #23 | Exceptional $122,764 |
| Immigrants | Northern Europe | 100.0 /100 | #24 | Exceptional $121,840 |
| Turks | 100.0 /100 | #25 | Exceptional $121,202 |
| Immigrants | Switzerland | 100.0 /100 | #26 | Exceptional $120,726 |
| Russians | 100.0 /100 | #27 | Exceptional $120,487 |
| Immigrants | Denmark | 100.0 /100 | #28 | Exceptional $120,445 |
| Latvians | 100.0 /100 | #29 | Exceptional $120,301 |
| Immigrants | Sri Lanka | 100.0 /100 | #30 | Exceptional $120,263 |
Demographics Similar to Crow by Median Family Income
In terms of median family income, the demographic groups most similar to Crow are Pueblo ($76,880, a difference of 0.36%), Houma ($76,188, a difference of 0.55%), Hopi ($77,188, a difference of 0.76%), Pima ($77,431, a difference of 1.1%), and Immigrants from Yemen ($77,457, a difference of 1.1%).
| Demographics | Rating | Rank | Median Family Income |
| Kiowa | 0.0 /100 | #333 | Tragic $80,885 |
| Menominee | 0.0 /100 | #334 | Tragic $79,563 |
| Yup'ik | 0.0 /100 | #335 | Tragic $79,290 |
| Immigrants | Cuba | 0.0 /100 | #336 | Tragic $78,249 |
| Yuman | 0.0 /100 | #337 | Tragic $78,055 |
| Immigrants | Yemen | 0.0 /100 | #338 | Tragic $77,457 |
| Pima | 0.0 /100 | #339 | Tragic $77,431 |
| Hopi | 0.0 /100 | #340 | Tragic $77,188 |
| Pueblo | 0.0 /100 | #341 | Tragic $76,880 |
| Crow | 0.0 /100 | #342 | Tragic $76,605 |
| Houma | 0.0 /100 | #343 | Tragic $76,188 |
| Tohono O'odham | 0.0 /100 | #344 | Tragic $72,193 |
| Navajo | 0.0 /100 | #345 | Tragic $70,989 |
| Puerto Ricans | 0.0 /100 | #346 | Tragic $70,423 |
| Lumbee | 0.0 /100 | #347 | Tragic $68,679 |