Immigrants from Europe vs Kenyan Wage/Income Gap
COMPARE
Immigrants from Europe
Kenyan
Wage/Income Gap
Wage/Income Gap Comparison
Immigrants from Europe
Kenyans
27.1%
WAGE/INCOME GAP
3.8/ 100
METRIC RATING
240th/ 347
METRIC RANK
24.5%
WAGE/INCOME GAP
95.8/ 100
METRIC RATING
119th/ 347
METRIC RANK
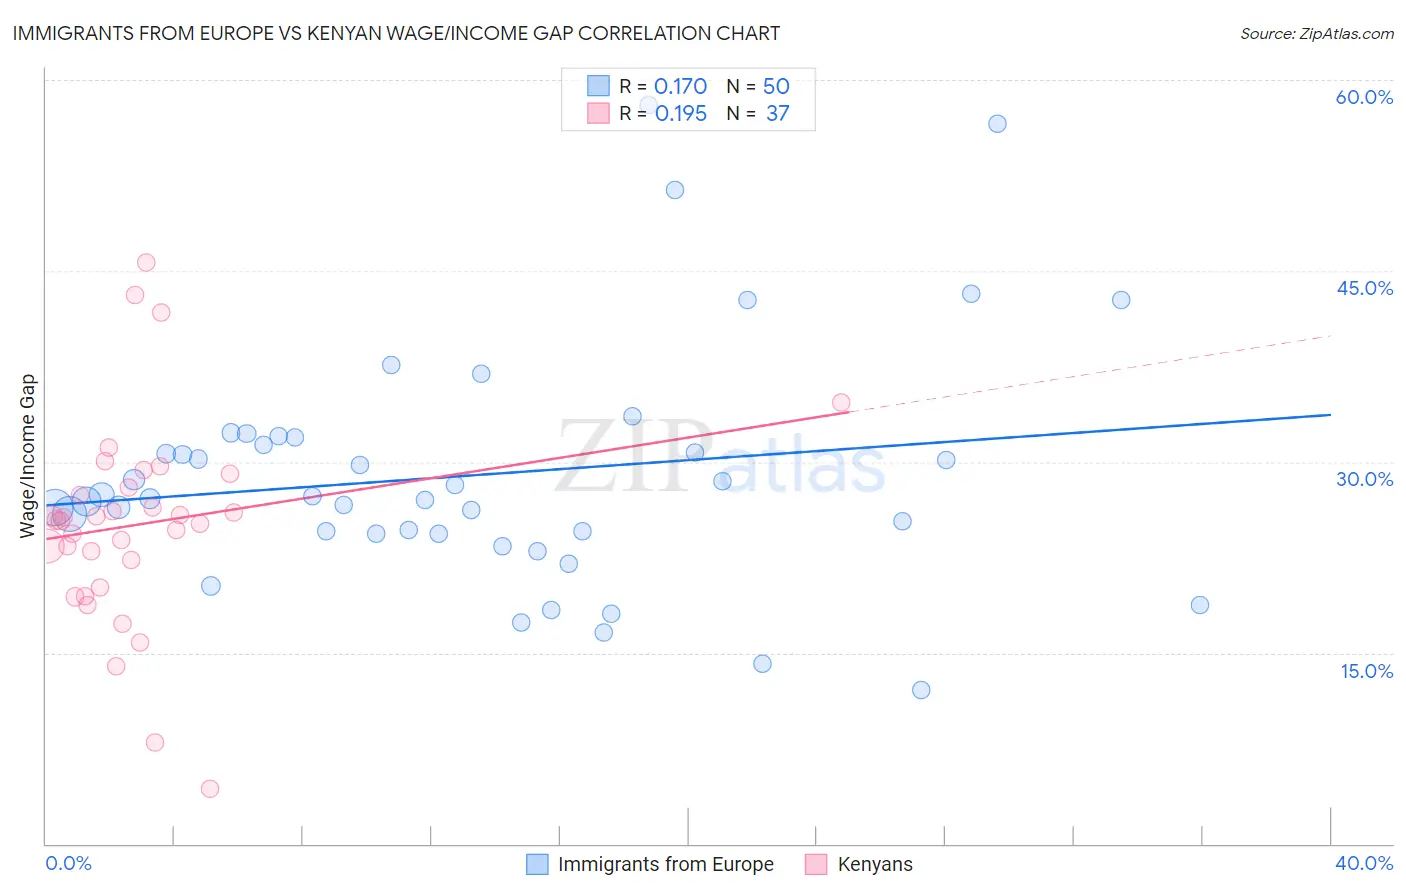
Immigrants from Europe vs Kenyan Wage/Income Gap Correlation Chart
The statistical analysis conducted on geographies consisting of 545,787,785 people shows a poor positive correlation between the proportion of Immigrants from Europe and wage/income gap percentage in the United States with a correlation coefficient (R) of 0.170 and weighted average of 27.1%. Similarly, the statistical analysis conducted on geographies consisting of 168,231,512 people shows a poor positive correlation between the proportion of Kenyans and wage/income gap percentage in the United States with a correlation coefficient (R) of 0.195 and weighted average of 24.5%, a difference of 10.9%.
Wage/Income Gap Correlation Summary
| Measurement | Immigrants from Europe | Kenyan |
| Minimum | 12.1% | 4.3% |
| Maximum | 58.0% | 45.6% |
| Range | 46.0% | 41.3% |
| Mean | 29.0% | 25.1% |
| Median | 27.2% | 25.4% |
| Interquartile 25% (IQ1) | 24.4% | 21.2% |
| Interquartile 75% (IQ3) | 32.0% | 28.5% |
| Interquartile Range (IQR) | 7.6% | 7.3% |
| Standard Deviation (Sample) | 9.5% | 8.2% |
| Standard Deviation (Population) | 9.4% | 8.1% |
Similar Demographics by Wage/Income Gap
Demographics Similar to Immigrants from Europe by Wage/Income Gap
In terms of wage/income gap, the demographic groups most similar to Immigrants from Europe are Creek (27.1%, a difference of 0.020%), Immigrants from Sri Lanka (27.1%, a difference of 0.070%), Spanish (27.1%, a difference of 0.080%), Chickasaw (27.2%, a difference of 0.15%), and Immigrants from the Azores (27.2%, a difference of 0.16%).
| Demographics | Rating | Rank | Wage/Income Gap |
| Immigrants | Brazil | 5.0 /100 | #233 | Tragic 27.0% |
| Immigrants | Pakistan | 4.9 /100 | #234 | Tragic 27.0% |
| Immigrants | Hungary | 4.8 /100 | #235 | Tragic 27.0% |
| Immigrants | Romania | 4.8 /100 | #236 | Tragic 27.0% |
| Immigrants | Eastern Asia | 4.4 /100 | #237 | Tragic 27.1% |
| Osage | 4.4 /100 | #238 | Tragic 27.1% |
| Estonians | 4.3 /100 | #239 | Tragic 27.1% |
| Immigrants | Europe | 3.8 /100 | #240 | Tragic 27.1% |
| Creek | 3.8 /100 | #241 | Tragic 27.1% |
| Immigrants | Sri Lanka | 3.7 /100 | #242 | Tragic 27.1% |
| Spanish | 3.6 /100 | #243 | Tragic 27.1% |
| Chickasaw | 3.5 /100 | #244 | Tragic 27.2% |
| Immigrants | Azores | 3.5 /100 | #245 | Tragic 27.2% |
| Immigrants | Nonimmigrants | 3.3 /100 | #246 | Tragic 27.2% |
| Celtics | 2.8 /100 | #247 | Tragic 27.3% |
Demographics Similar to Kenyans by Wage/Income Gap
In terms of wage/income gap, the demographic groups most similar to Kenyans are Immigrants from Micronesia (24.4%, a difference of 0.020%), Immigrants from Afghanistan (24.4%, a difference of 0.050%), Cree (24.5%, a difference of 0.070%), Alaska Native (24.4%, a difference of 0.11%), and Immigrants from Kenya (24.4%, a difference of 0.28%).
| Demographics | Rating | Rank | Wage/Income Gap |
| Immigrants | Colombia | 97.0 /100 | #112 | Exceptional 24.3% |
| Sioux | 96.9 /100 | #113 | Exceptional 24.3% |
| Panamanians | 96.5 /100 | #114 | Exceptional 24.4% |
| Immigrants | Kenya | 96.4 /100 | #115 | Exceptional 24.4% |
| Alaska Natives | 96.0 /100 | #116 | Exceptional 24.4% |
| Immigrants | Afghanistan | 95.9 /100 | #117 | Exceptional 24.4% |
| Immigrants | Micronesia | 95.8 /100 | #118 | Exceptional 24.4% |
| Kenyans | 95.8 /100 | #119 | Exceptional 24.5% |
| Cree | 95.6 /100 | #120 | Exceptional 24.5% |
| Immigrants | Thailand | 94.9 /100 | #121 | Exceptional 24.5% |
| Apache | 94.8 /100 | #122 | Exceptional 24.5% |
| Natives/Alaskans | 94.6 /100 | #123 | Exceptional 24.6% |
| Immigrants | South America | 93.9 /100 | #124 | Exceptional 24.6% |
| Spanish Americans | 93.8 /100 | #125 | Exceptional 24.6% |
| Immigrants | Uruguay | 93.8 /100 | #126 | Exceptional 24.6% |