Immigrants from Europe vs Immigrants from Croatia Wage/Income Gap
COMPARE
Immigrants from Europe
Immigrants from Croatia
Wage/Income Gap
Wage/Income Gap Comparison
Immigrants from Europe
Immigrants from Croatia
27.1%
WAGE/INCOME GAP
3.8/ 100
METRIC RATING
240th/ 347
METRIC RANK
26.2%
WAGE/INCOME GAP
24.8/ 100
METRIC RATING
190th/ 347
METRIC RANK
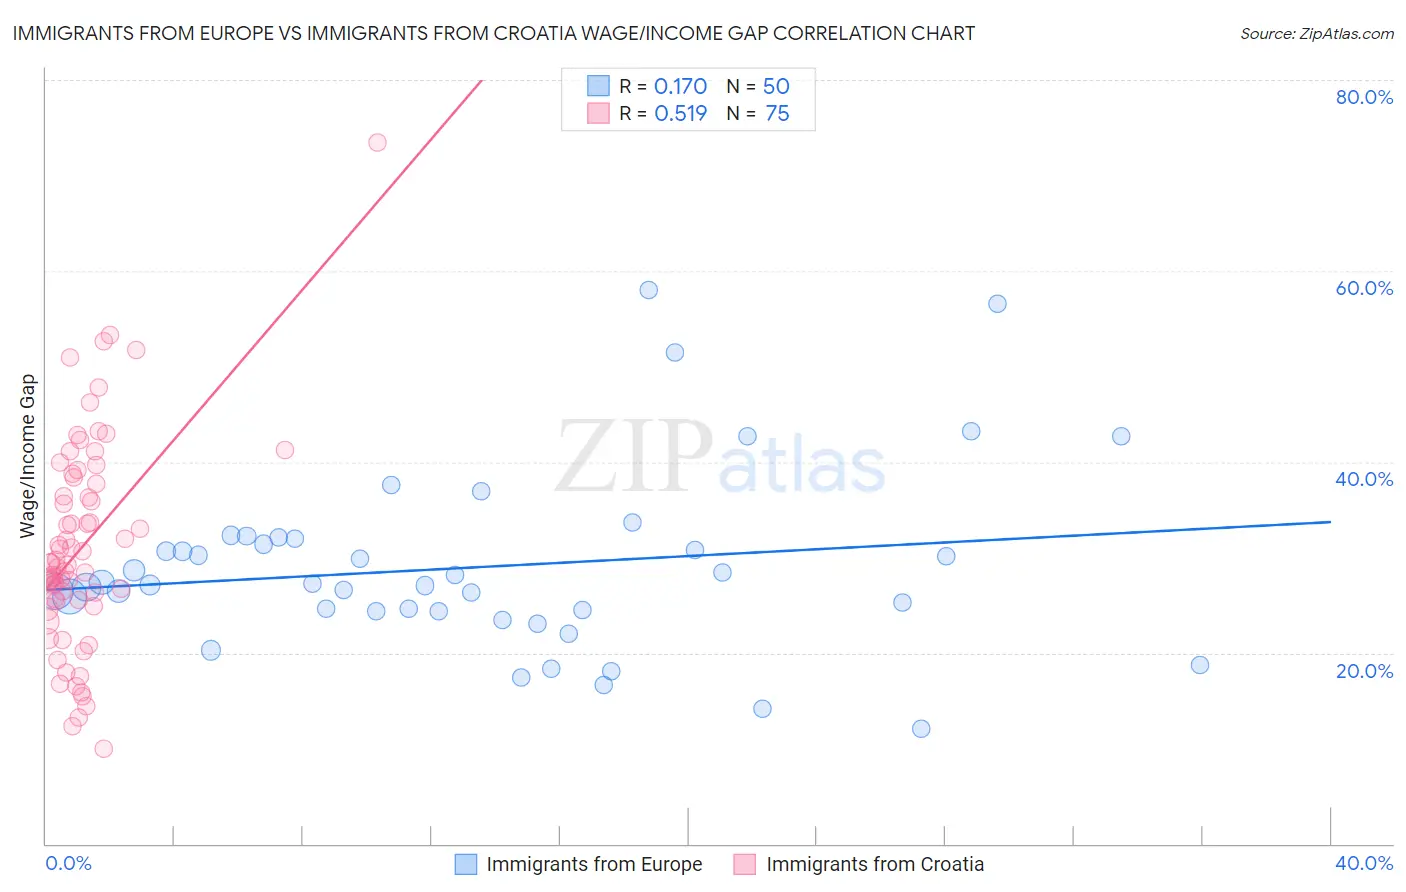
Immigrants from Europe vs Immigrants from Croatia Wage/Income Gap Correlation Chart
The statistical analysis conducted on geographies consisting of 545,787,785 people shows a poor positive correlation between the proportion of Immigrants from Europe and wage/income gap percentage in the United States with a correlation coefficient (R) of 0.170 and weighted average of 27.1%. Similarly, the statistical analysis conducted on geographies consisting of 132,560,364 people shows a substantial positive correlation between the proportion of Immigrants from Croatia and wage/income gap percentage in the United States with a correlation coefficient (R) of 0.519 and weighted average of 26.2%, a difference of 3.4%.
Wage/Income Gap Correlation Summary
| Measurement | Immigrants from Europe | Immigrants from Croatia |
| Minimum | 12.1% | 10.0% |
| Maximum | 58.0% | 73.5% |
| Range | 46.0% | 63.5% |
| Mean | 29.0% | 31.2% |
| Median | 27.2% | 29.4% |
| Interquartile 25% (IQ1) | 24.4% | 25.4% |
| Interquartile 75% (IQ3) | 32.0% | 38.4% |
| Interquartile Range (IQR) | 7.6% | 13.0% |
| Standard Deviation (Sample) | 9.5% | 11.1% |
| Standard Deviation (Population) | 9.4% | 11.0% |
Similar Demographics by Wage/Income Gap
Demographics Similar to Immigrants from Europe by Wage/Income Gap
In terms of wage/income gap, the demographic groups most similar to Immigrants from Europe are Creek (27.1%, a difference of 0.020%), Immigrants from Sri Lanka (27.1%, a difference of 0.070%), Spanish (27.1%, a difference of 0.080%), Chickasaw (27.2%, a difference of 0.15%), and Immigrants from the Azores (27.2%, a difference of 0.16%).
| Demographics | Rating | Rank | Wage/Income Gap |
| Immigrants | Brazil | 5.0 /100 | #233 | Tragic 27.0% |
| Immigrants | Pakistan | 4.9 /100 | #234 | Tragic 27.0% |
| Immigrants | Hungary | 4.8 /100 | #235 | Tragic 27.0% |
| Immigrants | Romania | 4.8 /100 | #236 | Tragic 27.0% |
| Immigrants | Eastern Asia | 4.4 /100 | #237 | Tragic 27.1% |
| Osage | 4.4 /100 | #238 | Tragic 27.1% |
| Estonians | 4.3 /100 | #239 | Tragic 27.1% |
| Immigrants | Europe | 3.8 /100 | #240 | Tragic 27.1% |
| Creek | 3.8 /100 | #241 | Tragic 27.1% |
| Immigrants | Sri Lanka | 3.7 /100 | #242 | Tragic 27.1% |
| Spanish | 3.6 /100 | #243 | Tragic 27.1% |
| Chickasaw | 3.5 /100 | #244 | Tragic 27.2% |
| Immigrants | Azores | 3.5 /100 | #245 | Tragic 27.2% |
| Immigrants | Nonimmigrants | 3.3 /100 | #246 | Tragic 27.2% |
| Celtics | 2.8 /100 | #247 | Tragic 27.3% |
Demographics Similar to Immigrants from Croatia by Wage/Income Gap
In terms of wage/income gap, the demographic groups most similar to Immigrants from Croatia are Immigrants from Venezuela (26.2%, a difference of 0.020%), Immigrants from Moldova (26.2%, a difference of 0.15%), Immigrants from Bulgaria (26.3%, a difference of 0.20%), Immigrants from Jordan (26.3%, a difference of 0.22%), and Chilean (26.3%, a difference of 0.22%).
| Demographics | Rating | Rank | Wage/Income Gap |
| Immigrants | Kazakhstan | 35.2 /100 | #183 | Fair 26.0% |
| Mexicans | 34.4 /100 | #184 | Fair 26.0% |
| Pakistanis | 33.7 /100 | #185 | Fair 26.1% |
| Immigrants | Indonesia | 32.5 /100 | #186 | Fair 26.1% |
| Palestinians | 29.9 /100 | #187 | Fair 26.1% |
| Immigrants | Egypt | 29.9 /100 | #188 | Fair 26.1% |
| Immigrants | Moldova | 26.6 /100 | #189 | Fair 26.2% |
| Immigrants | Croatia | 24.8 /100 | #190 | Fair 26.2% |
| Immigrants | Venezuela | 24.7 /100 | #191 | Fair 26.2% |
| Immigrants | Bulgaria | 22.5 /100 | #192 | Fair 26.3% |
| Immigrants | Jordan | 22.4 /100 | #193 | Fair 26.3% |
| Chileans | 22.3 /100 | #194 | Fair 26.3% |
| Immigrants | Malaysia | 22.2 /100 | #195 | Fair 26.3% |
| Immigrants | Western Asia | 21.7 /100 | #196 | Fair 26.3% |
| Zimbabweans | 21.6 /100 | #197 | Fair 26.3% |