Immigrants from Vietnam vs Kenyan Wage/Income Gap
COMPARE
Immigrants from Vietnam
Kenyan
Wage/Income Gap
Wage/Income Gap Comparison
Immigrants from Vietnam
Kenyans
25.2%
WAGE/INCOME GAP
77.7/ 100
METRIC RATING
155th/ 347
METRIC RANK
24.5%
WAGE/INCOME GAP
95.8/ 100
METRIC RATING
119th/ 347
METRIC RANK
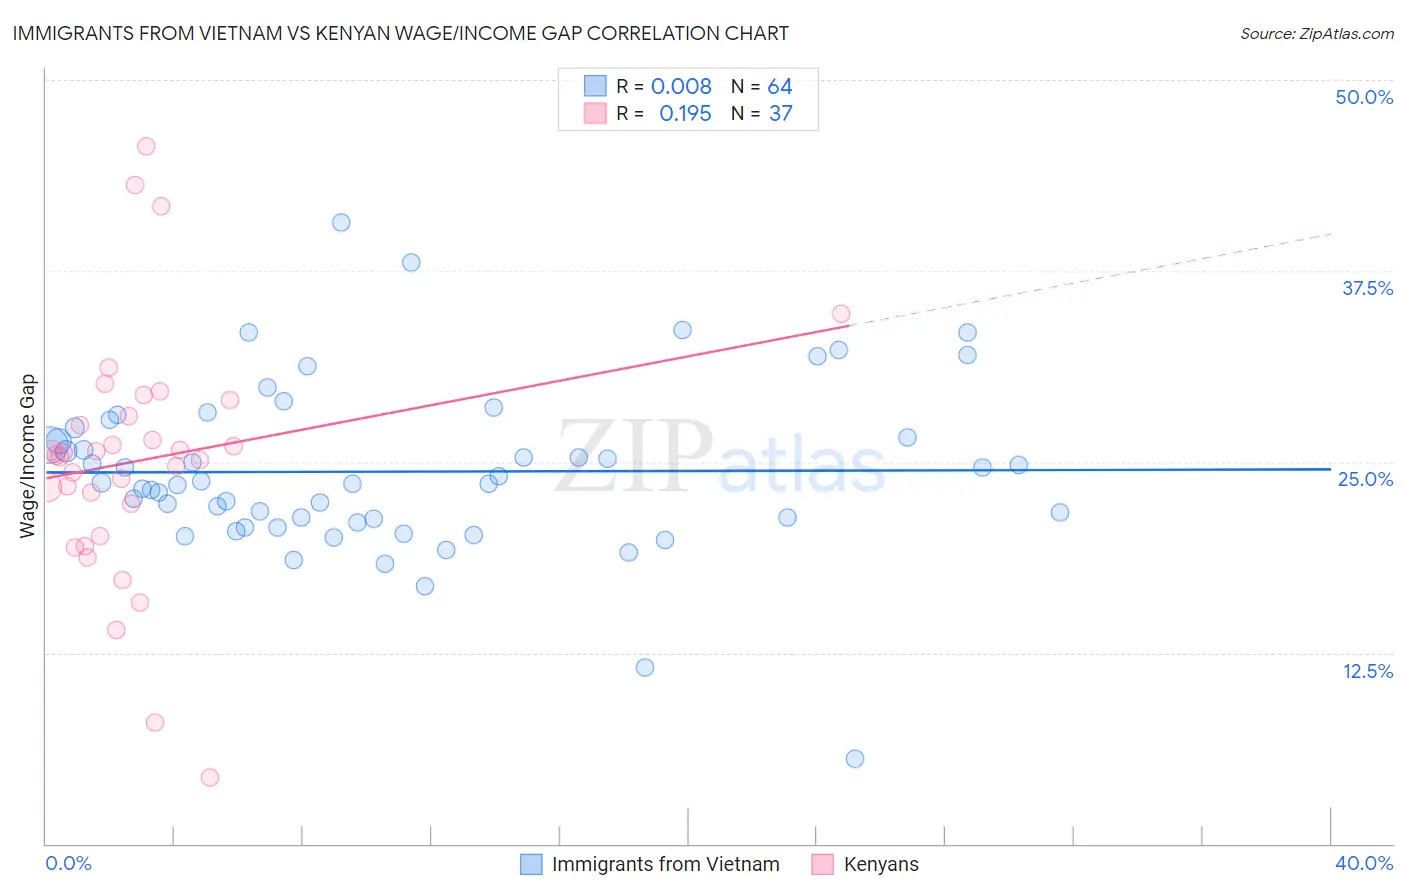
Immigrants from Vietnam vs Kenyan Wage/Income Gap Correlation Chart
The statistical analysis conducted on geographies consisting of 404,669,724 people shows no correlation between the proportion of Immigrants from Vietnam and wage/income gap percentage in the United States with a correlation coefficient (R) of 0.008 and weighted average of 25.2%. Similarly, the statistical analysis conducted on geographies consisting of 168,231,512 people shows a poor positive correlation between the proportion of Kenyans and wage/income gap percentage in the United States with a correlation coefficient (R) of 0.195 and weighted average of 24.5%, a difference of 3.2%.
Wage/Income Gap Correlation Summary
| Measurement | Immigrants from Vietnam | Kenyan |
| Minimum | 5.6% | 4.3% |
| Maximum | 40.6% | 45.6% |
| Range | 35.1% | 41.3% |
| Mean | 24.4% | 25.1% |
| Median | 23.6% | 25.4% |
| Interquartile 25% (IQ1) | 21.1% | 21.2% |
| Interquartile 75% (IQ3) | 26.9% | 28.5% |
| Interquartile Range (IQR) | 5.8% | 7.3% |
| Standard Deviation (Sample) | 5.6% | 8.2% |
| Standard Deviation (Population) | 5.6% | 8.1% |
Similar Demographics by Wage/Income Gap
Demographics Similar to Immigrants from Vietnam by Wage/Income Gap
In terms of wage/income gap, the demographic groups most similar to Immigrants from Vietnam are Blackfeet (25.2%, a difference of 0.040%), Immigrants from Northern Africa (25.2%, a difference of 0.040%), Immigrants from Mexico (25.3%, a difference of 0.12%), Costa Rican (25.3%, a difference of 0.18%), and Immigrants from Zimbabwe (25.3%, a difference of 0.36%).
| Demographics | Rating | Rank | Wage/Income Gap |
| Iroquois | 83.9 /100 | #148 | Excellent 25.1% |
| Immigrants | Peru | 82.6 /100 | #149 | Excellent 25.1% |
| Immigrants | Immigrants | 82.3 /100 | #150 | Excellent 25.1% |
| Taiwanese | 81.6 /100 | #151 | Excellent 25.1% |
| Uruguayans | 81.3 /100 | #152 | Excellent 25.2% |
| Blackfeet | 78.1 /100 | #153 | Good 25.2% |
| Immigrants | Northern Africa | 78.1 /100 | #154 | Good 25.2% |
| Immigrants | Vietnam | 77.7 /100 | #155 | Good 25.2% |
| Immigrants | Mexico | 76.4 /100 | #156 | Good 25.3% |
| Costa Ricans | 75.8 /100 | #157 | Good 25.3% |
| Immigrants | Zimbabwe | 73.7 /100 | #158 | Good 25.3% |
| Puget Sound Salish | 73.0 /100 | #159 | Good 25.3% |
| French American Indians | 72.5 /100 | #160 | Good 25.4% |
| Albanians | 69.4 /100 | #161 | Good 25.4% |
| Shoshone | 69.0 /100 | #162 | Good 25.4% |
Demographics Similar to Kenyans by Wage/Income Gap
In terms of wage/income gap, the demographic groups most similar to Kenyans are Immigrants from Micronesia (24.4%, a difference of 0.020%), Immigrants from Afghanistan (24.4%, a difference of 0.050%), Cree (24.5%, a difference of 0.070%), Alaska Native (24.4%, a difference of 0.11%), and Immigrants from Kenya (24.4%, a difference of 0.28%).
| Demographics | Rating | Rank | Wage/Income Gap |
| Immigrants | Colombia | 97.0 /100 | #112 | Exceptional 24.3% |
| Sioux | 96.9 /100 | #113 | Exceptional 24.3% |
| Panamanians | 96.5 /100 | #114 | Exceptional 24.4% |
| Immigrants | Kenya | 96.4 /100 | #115 | Exceptional 24.4% |
| Alaska Natives | 96.0 /100 | #116 | Exceptional 24.4% |
| Immigrants | Afghanistan | 95.9 /100 | #117 | Exceptional 24.4% |
| Immigrants | Micronesia | 95.8 /100 | #118 | Exceptional 24.4% |
| Kenyans | 95.8 /100 | #119 | Exceptional 24.5% |
| Cree | 95.6 /100 | #120 | Exceptional 24.5% |
| Immigrants | Thailand | 94.9 /100 | #121 | Exceptional 24.5% |
| Apache | 94.8 /100 | #122 | Exceptional 24.5% |
| Natives/Alaskans | 94.6 /100 | #123 | Exceptional 24.6% |
| Immigrants | South America | 93.9 /100 | #124 | Exceptional 24.6% |
| Spanish Americans | 93.8 /100 | #125 | Exceptional 24.6% |
| Immigrants | Uruguay | 93.8 /100 | #126 | Exceptional 24.6% |