Immigrants from China vs Immigrants from Asia 5th Grade
COMPARE
Immigrants from China
Immigrants from Asia
5th Grade
5th Grade Comparison
Immigrants from China
Immigrants from Asia
96.8%
5TH GRADE
0.5/ 100
METRIC RATING
259th/ 347
METRIC RANK
96.9%
5TH GRADE
1.7/ 100
METRIC RATING
241st/ 347
METRIC RANK
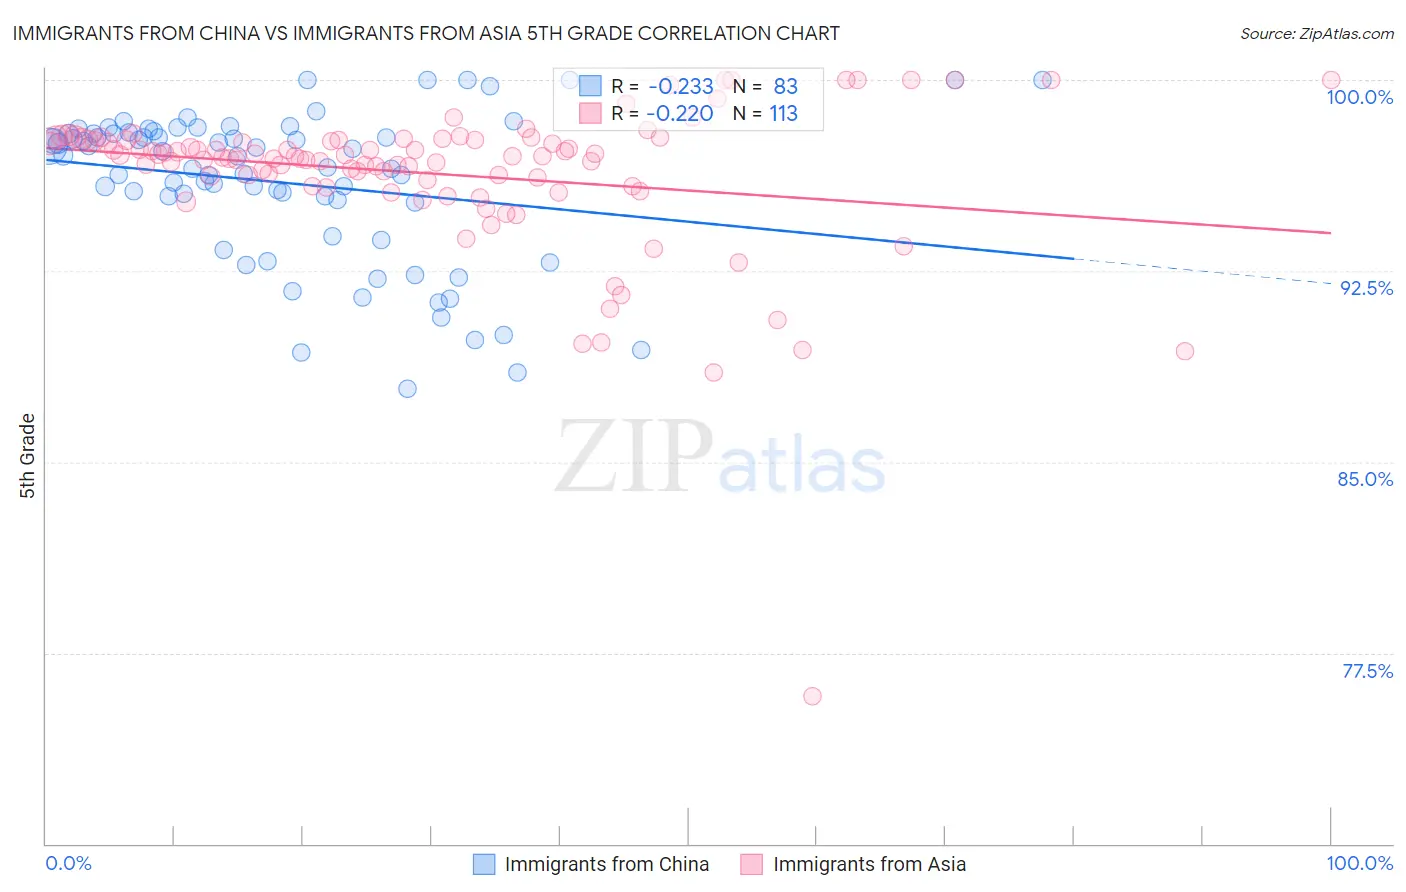
Immigrants from China vs Immigrants from Asia 5th Grade Correlation Chart
The statistical analysis conducted on geographies consisting of 457,082,957 people shows a weak negative correlation between the proportion of Immigrants from China and percentage of population with at least 5th grade education in the United States with a correlation coefficient (R) of -0.233 and weighted average of 96.8%. Similarly, the statistical analysis conducted on geographies consisting of 549,170,438 people shows a weak negative correlation between the proportion of Immigrants from Asia and percentage of population with at least 5th grade education in the United States with a correlation coefficient (R) of -0.220 and weighted average of 96.9%, a difference of 0.14%.
5th Grade Correlation Summary
| Measurement | Immigrants from China | Immigrants from Asia |
| Minimum | 87.9% | 75.8% |
| Maximum | 100.0% | 100.0% |
| Range | 12.1% | 24.2% |
| Mean | 96.0% | 96.3% |
| Median | 97.0% | 97.0% |
| Interquartile 25% (IQ1) | 95.2% | 96.0% |
| Interquartile 75% (IQ3) | 97.9% | 97.6% |
| Interquartile Range (IQR) | 2.7% | 1.7% |
| Standard Deviation (Sample) | 3.0% | 3.0% |
| Standard Deviation (Population) | 2.9% | 3.0% |
Demographics Similar to Immigrants from China and Immigrants from Asia by 5th Grade
In terms of 5th grade, the demographic groups most similar to Immigrants from China are Immigrants from Ethiopia (96.8%, a difference of 0.0%), Immigrants from Jamaica (96.8%, a difference of 0.020%), Peruvian (96.8%, a difference of 0.030%), South American (96.8%, a difference of 0.040%), and Immigrants from Congo (96.8%, a difference of 0.040%). Similarly, the demographic groups most similar to Immigrants from Asia are Immigrants from Costa Rica (96.9%, a difference of 0.0%), Immigrants from Eastern Africa (96.9%, a difference of 0.0%), Indian (Asian) (96.9%, a difference of 0.010%), Korean (96.9%, a difference of 0.010%), and Colombian (96.9%, a difference of 0.020%).
| Demographics | Rating | Rank | 5th Grade |
| Indians (Asian) | 1.9 /100 | #240 | Tragic 96.9% |
| Immigrants | Asia | 1.7 /100 | #241 | Tragic 96.9% |
| Immigrants | Costa Rica | 1.6 /100 | #242 | Tragic 96.9% |
| Immigrants | Eastern Africa | 1.6 /100 | #243 | Tragic 96.9% |
| Koreans | 1.6 /100 | #244 | Tragic 96.9% |
| Colombians | 1.3 /100 | #245 | Tragic 96.9% |
| Ethiopians | 1.2 /100 | #246 | Tragic 96.9% |
| Immigrants | Africa | 1.1 /100 | #247 | Tragic 96.9% |
| U.S. Virgin Islanders | 1.1 /100 | #248 | Tragic 96.9% |
| Immigrants | Uruguay | 1.0 /100 | #249 | Tragic 96.9% |
| Immigrants | Liberia | 1.0 /100 | #250 | Tragic 96.9% |
| Bolivians | 0.9 /100 | #251 | Tragic 96.9% |
| Jamaicans | 0.9 /100 | #252 | Tragic 96.9% |
| Immigrants | Middle Africa | 0.8 /100 | #253 | Tragic 96.8% |
| Immigrants | Senegal | 0.8 /100 | #254 | Tragic 96.8% |
| South Americans | 0.7 /100 | #255 | Tragic 96.8% |
| Immigrants | Congo | 0.7 /100 | #256 | Tragic 96.8% |
| Peruvians | 0.6 /100 | #257 | Tragic 96.8% |
| Immigrants | Ethiopia | 0.5 /100 | #258 | Tragic 96.8% |
| Immigrants | China | 0.5 /100 | #259 | Tragic 96.8% |
| Immigrants | Jamaica | 0.4 /100 | #260 | Tragic 96.8% |