Immigrants from Canada vs Immigrants from Barbados Householder Income Under 25 years
COMPARE
Immigrants from Canada
Immigrants from Barbados
Householder Income Under 25 years
Householder Income Under 25 years Comparison
Immigrants from Canada
Immigrants from Barbados
$53,411
HOUSEHOLDER INCOME UNDER 25 YEARS
95.2/ 100
METRIC RATING
121st/ 347
METRIC RANK
$53,163
HOUSEHOLDER INCOME UNDER 25 YEARS
91.5/ 100
METRIC RATING
137th/ 347
METRIC RANK
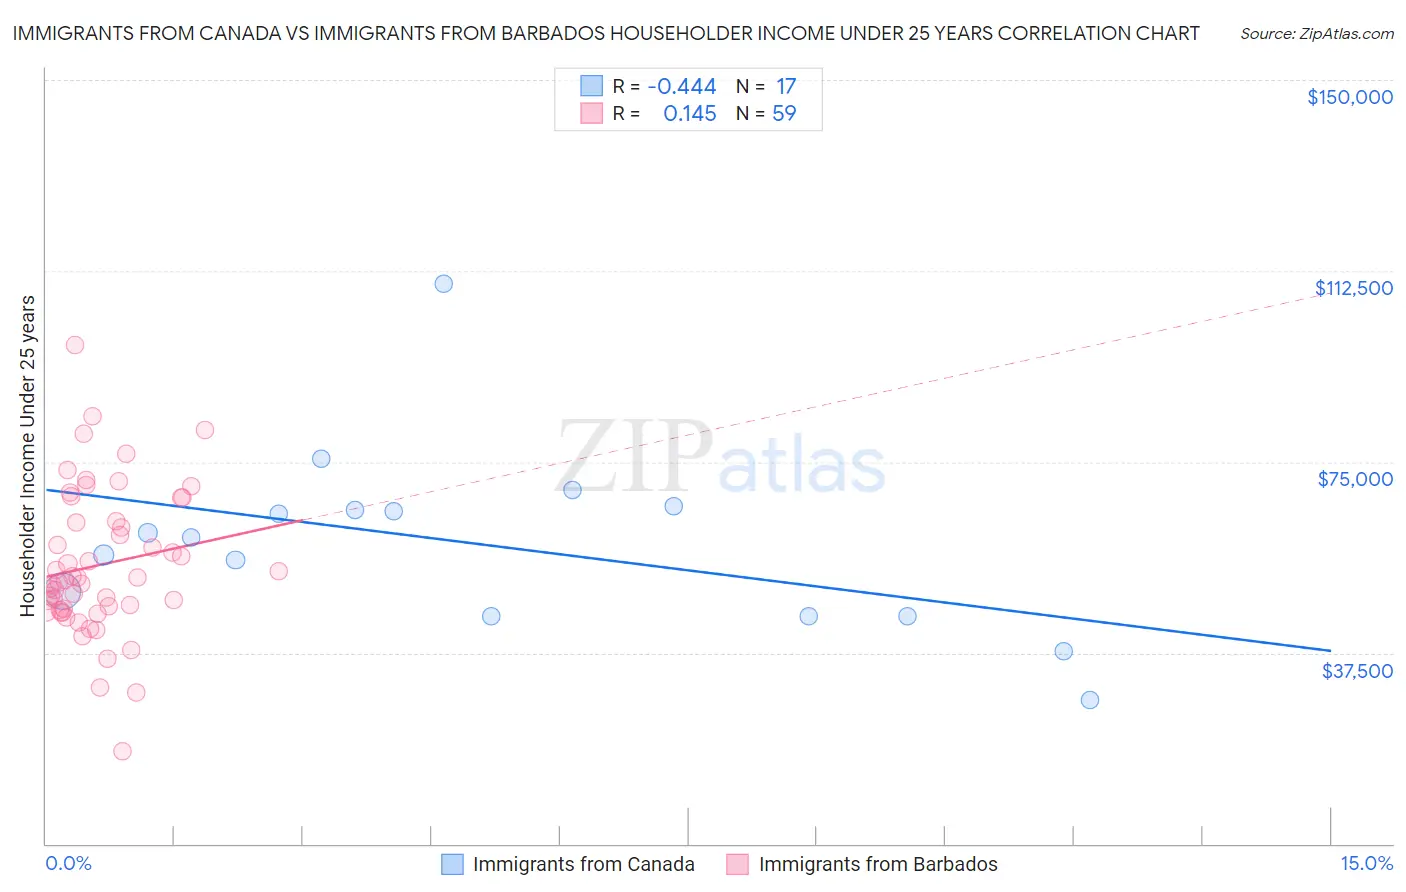
Immigrants from Canada vs Immigrants from Barbados Householder Income Under 25 years Correlation Chart
The statistical analysis conducted on geographies consisting of 375,368,840 people shows a moderate negative correlation between the proportion of Immigrants from Canada and household income with householder under the age of 25 in the United States with a correlation coefficient (R) of -0.444 and weighted average of $53,411. Similarly, the statistical analysis conducted on geographies consisting of 102,730,809 people shows a poor positive correlation between the proportion of Immigrants from Barbados and household income with householder under the age of 25 in the United States with a correlation coefficient (R) of 0.145 and weighted average of $53,163, a difference of 0.47%.
Householder Income Under 25 years Correlation Summary
| Measurement | Immigrants from Canada | Immigrants from Barbados |
| Minimum | $28,317 | $18,183 |
| Maximum | $109,961 | $98,041 |
| Range | $81,644 | $79,858 |
| Mean | $58,863 | $54,788 |
| Median | $60,245 | $51,763 |
| Interquartile 25% (IQ1) | $44,733 | $46,030 |
| Interquartile 75% (IQ3) | $65,961 | $63,444 |
| Interquartile Range (IQR) | $21,228 | $17,414 |
| Standard Deviation (Sample) | $18,135 | $14,303 |
| Standard Deviation (Population) | $17,594 | $14,181 |
Demographics Similar to Immigrants from Canada and Immigrants from Barbados by Householder Income Under 25 years
In terms of householder income under 25 years, the demographic groups most similar to Immigrants from Canada are Immigrants from Ethiopia ($53,408, a difference of 0.010%), Guamanian/Chamorro ($53,423, a difference of 0.020%), Italian ($53,426, a difference of 0.030%), Immigrants from Iraq ($53,384, a difference of 0.050%), and Colombian ($53,357, a difference of 0.10%). Similarly, the demographic groups most similar to Immigrants from Barbados are Armenian ($53,179, a difference of 0.030%), Immigrants from Northern Africa ($53,185, a difference of 0.040%), Chilean ($53,185, a difference of 0.040%), Immigrants ($53,201, a difference of 0.070%), and Norwegian ($53,127, a difference of 0.070%).
| Demographics | Rating | Rank | Householder Income Under 25 years |
| Italians | 95.4 /100 | #119 | Exceptional $53,426 |
| Guamanians/Chamorros | 95.3 /100 | #120 | Exceptional $53,423 |
| Immigrants | Canada | 95.2 /100 | #121 | Exceptional $53,411 |
| Immigrants | Ethiopia | 95.2 /100 | #122 | Exceptional $53,408 |
| Immigrants | Iraq | 94.9 /100 | #123 | Exceptional $53,384 |
| Colombians | 94.6 /100 | #124 | Exceptional $53,357 |
| Pakistanis | 94.1 /100 | #125 | Exceptional $53,325 |
| Immigrants | Serbia | 94.1 /100 | #126 | Exceptional $53,321 |
| Immigrants | North America | 93.9 /100 | #127 | Exceptional $53,307 |
| Immigrants | Bulgaria | 93.9 /100 | #128 | Exceptional $53,305 |
| New Zealanders | 93.7 /100 | #129 | Exceptional $53,294 |
| Nicaraguans | 93.4 /100 | #130 | Exceptional $53,275 |
| Immigrants | Nicaragua | 93.3 /100 | #131 | Exceptional $53,266 |
| Moroccans | 93.1 /100 | #132 | Exceptional $53,256 |
| Immigrants | Immigrants | 92.2 /100 | #133 | Exceptional $53,201 |
| Immigrants | Northern Africa | 91.9 /100 | #134 | Exceptional $53,185 |
| Chileans | 91.9 /100 | #135 | Exceptional $53,185 |
| Armenians | 91.8 /100 | #136 | Exceptional $53,179 |
| Immigrants | Barbados | 91.5 /100 | #137 | Exceptional $53,163 |
| Norwegians | 90.8 /100 | #138 | Exceptional $53,127 |
| Costa Ricans | 90.4 /100 | #139 | Exceptional $53,106 |