Immigrants from Burma/Myanmar vs Filipino In Labor Force | Age 25-29

COMPARE

Immigrants from Burma/Myanmar
Race
Ancestry
AfghanAfricanAlaska NativeAlaskan AthabascanAlbanianAleutAlsatianAmericanApacheArabArapahoArgentineanArmenianAssyrian/Chaldean/SyriacAustralianAustrianBahamianBangladeshiBarbadianBasqueBelgianBelizeanBermudanBhutaneseBlackfeetBolivianBrazilianBritishBritish West IndianBulgarianBurmeseCajunCambodianCanadianCape VerdeanCarpatho RusynCelticCentral AmericanCentral American IndianCherokeeCheyenneChickasawChileanChineseChippewaChoctawColombianColvilleComancheCosta RicanCreeCreekCroatianCrowCubanCypriotCzechCzechoslovakianDanishDelawareDominicanDutchDutch West IndianEastern EuropeanEcuadorianEgyptianEnglishEstonianEthiopianEuropeanFijianFinnishFrenchFrench American IndianFrench CanadianGermanGerman RussianGhanaianGreekGuamanian/ChamorroGuatemalanGuyaneseHaitianHmongHonduranHopiHoumaHungarianIcelanderIndian (Asian)IndonesianInupiatIranianIraqiIrishIroquoisIsraeliItalianJamaicanJapaneseJordanianKenyanKiowaKoreanLaotianLatvianLebaneseLiberianLithuanianLumbeeLuxembourgerMacedonianMalaysianMalteseMarshalleseMenomineeMexicanMexican American IndianMongolianMoroccanNative HawaiianNavajoNepaleseNew ZealanderNicaraguanNigerianNorthern EuropeanNorwegianOkinawanOsageOttawaPaiutePakistaniPalestinianPanamanianParaguayanPennsylvania GermanPeruvianPimaPolishPortuguesePotawatomiPuebloPuerto RicanPuget Sound SalishRomanianRussianSalvadoranSamoanScandinavianScotch-IrishScottishSeminoleSenegaleseSerbianShoshoneSierra LeoneanSiouxSlavicSlovakSloveneSomaliSouth AfricanSouth AmericanSouth American IndianSoviet UnionSpaniardSpanishSpanish AmericanSpanish American IndianSri LankanSubsaharan AfricanSudaneseSwedishSwissSyrianTaiwaneseThaiTlingit-HaidaTohono O'OdhamTonganTrinidadian and TobagonianTsimshianTurkishU.S. Virgin IslanderUgandanUkrainianUruguayanUteVenezuelanVietnameseWelshWest IndianYakamaYaquiYugoslavianYumanYup'ikZimbabwean
Immigration
NonimmigrantsImmigrantsAfghanistanAfricaAlbaniaArgentinaArmeniaAsiaAustraliaAustriaBahamasBangladeshBarbadosBelarusBelgiumBelizeBoliviaBosnia and HerzegovinaBrazilBulgariaBurma/MyanmarCabo VerdeCambodiaCameroonCanadaCaribbeanCentral AmericaChileChinaColombiaCongoCosta RicaCroatiaCubaCzechoslovakiaDenmarkDominicaDominican RepublicEastern AfricaEastern AsiaEastern EuropeEcuadorEgyptEl SalvadorEnglandEritreaEthiopiaEuropeFijiFranceGermanyGhanaGreeceGrenadaGuatemalaGuyanaHaitiHondurasHong KongHungaryIndiaIndonesiaIranIraqIrelandIsraelItalyJamaicaJapanJordanKazakhstanKenyaKoreaKuwaitLaosLatin AmericaLatviaLebanonLiberiaLithuaniaMalaysiaMexicoMicronesiaMiddle AfricaMoldovaMoroccoNepalNetherlandsNicaraguaNigeriaNorth AmericaNorth MacedoniaNorthern AfricaNorthern EuropeNorwayOceaniaPakistanPanamaPeruPhilippinesPolandPortugalRomaniaRussiaSaudi ArabiaScotlandSenegalSerbiaSierra LeoneSingaporeSomaliaSouth AfricaSouth AmericaSouth Central AsiaSouth Eastern AsiaSouthern EuropeSpainSri LankaSt. Vincent and the GrenadinesSudanSwedenSwitzerlandSyriaTaiwanThailandTrinidad and TobagoTurkeyUgandaUkraineUruguayUzbekistanVenezuelaVietnamWest IndiesWestern AfricaWestern AsiaWestern EuropeYemenZaireZimbabweAzores
Filipino
Race
Ancestry
AfghanAfricanAlaska NativeAlaskan AthabascanAlbanianAleutAlsatianAmericanApacheArabArapahoArgentineanArmenianAssyrian/Chaldean/SyriacAustralianAustrianBahamianBangladeshiBarbadianBasqueBelgianBelizeanBermudanBhutaneseBlackfeetBolivianBrazilianBritishBritish West IndianBulgarianBurmeseCajunCambodianCanadianCape VerdeanCarpatho RusynCelticCentral AmericanCentral American IndianCherokeeCheyenneChickasawChileanChineseChippewaChoctawColombianColvilleComancheCosta RicanCreeCreekCroatianCrowCubanCypriotCzechCzechoslovakianDanishDelawareDominicanDutchDutch West IndianEastern EuropeanEcuadorianEgyptianEnglishEstonianEthiopianEuropeanFijianFilipinoFinnishFrenchFrench American IndianFrench CanadianGermanGerman RussianGhanaianGreekGuamanian/ChamorroGuatemalanGuyaneseHaitianHmongHonduranHopiHoumaHungarianIcelanderIndian (Asian)IndonesianInupiatIranianIraqiIrishIroquoisIsraeliItalianJamaicanJapaneseJordanianKenyanKiowaKoreanLaotianLatvianLebaneseLiberianLithuanianLumbeeLuxembourgerMacedonianMalaysianMalteseMarshalleseMenomineeMexicanMexican American IndianMongolianMoroccanNative HawaiianNavajoNepaleseNew ZealanderNicaraguanNigerianNorthern EuropeanNorwegianOkinawanOsageOttawaPaiutePakistaniPalestinianPanamanianParaguayanPennsylvania GermanPeruvianPimaPolishPortuguesePotawatomiPuebloPuerto RicanPuget Sound SalishRomanianRussianSalvadoranSamoanScandinavianScotch-IrishScottishSeminoleSenegaleseSerbianShoshoneSierra LeoneanSiouxSlavicSlovakSloveneSomaliSouth AfricanSouth AmericanSouth American IndianSoviet UnionSpaniardSpanishSpanish AmericanSpanish American IndianSri LankanSubsaharan AfricanSudaneseSwedishSwissSyrianTaiwaneseThaiTlingit-HaidaTohono O'OdhamTonganTrinidadian and TobagonianTsimshianTurkishU.S. Virgin IslanderUgandanUkrainianUruguayanUteVenezuelanVietnameseWelshWest IndianYakamaYaquiYugoslavianYumanYup'ikZimbabwean
Immigration
NonimmigrantsImmigrantsAfghanistanAfricaAlbaniaArgentinaArmeniaAsiaAustraliaAustriaBahamasBangladeshBarbadosBelarusBelgiumBelizeBoliviaBosnia and HerzegovinaBrazilBulgariaCabo VerdeCambodiaCameroonCanadaCaribbeanCentral AmericaChileChinaColombiaCongoCosta RicaCroatiaCubaCzechoslovakiaDenmarkDominicaDominican RepublicEastern AfricaEastern AsiaEastern EuropeEcuadorEgyptEl SalvadorEnglandEritreaEthiopiaEuropeFijiFranceGermanyGhanaGreeceGrenadaGuatemalaGuyanaHaitiHondurasHong KongHungaryIndiaIndonesiaIranIraqIrelandIsraelItalyJamaicaJapanJordanKazakhstanKenyaKoreaKuwaitLaosLatin AmericaLatviaLebanonLiberiaLithuaniaMalaysiaMexicoMicronesiaMiddle AfricaMoldovaMoroccoNepalNetherlandsNicaraguaNigeriaNorth AmericaNorth MacedoniaNorthern AfricaNorthern EuropeNorwayOceaniaPakistanPanamaPeruPhilippinesPolandPortugalRomaniaRussiaSaudi ArabiaScotlandSenegalSerbiaSierra LeoneSingaporeSomaliaSouth AfricaSouth AmericaSouth Central AsiaSouth Eastern AsiaSouthern EuropeSpainSri LankaSt. Vincent and the GrenadinesSudanSwedenSwitzerlandSyriaTaiwanThailandTrinidad and TobagoTurkeyUgandaUkraineUruguayUzbekistanVenezuelaVietnamWest IndiesWestern AfricaWestern AsiaWestern EuropeYemenZaireZimbabweAzores
In Labor Force | Age 25-29
Income
Poverty
Unemployment
Labor Participation
Family Structure
Vehicle Availability
Education Level
Disability

In Labor Force | Age 25-29 Comparison

Immigrants from Burma/Myanmar

Filipinos

Average
Excellent
84.7%
IN LABOR FORCE | AGE 25-29
57.4/ 100
METRIC RATING
165th/ 347
METRIC RANK
84.9%
IN LABOR FORCE | AGE 25-29
87.1/ 100
METRIC RATING
119th/ 347
METRIC RANK

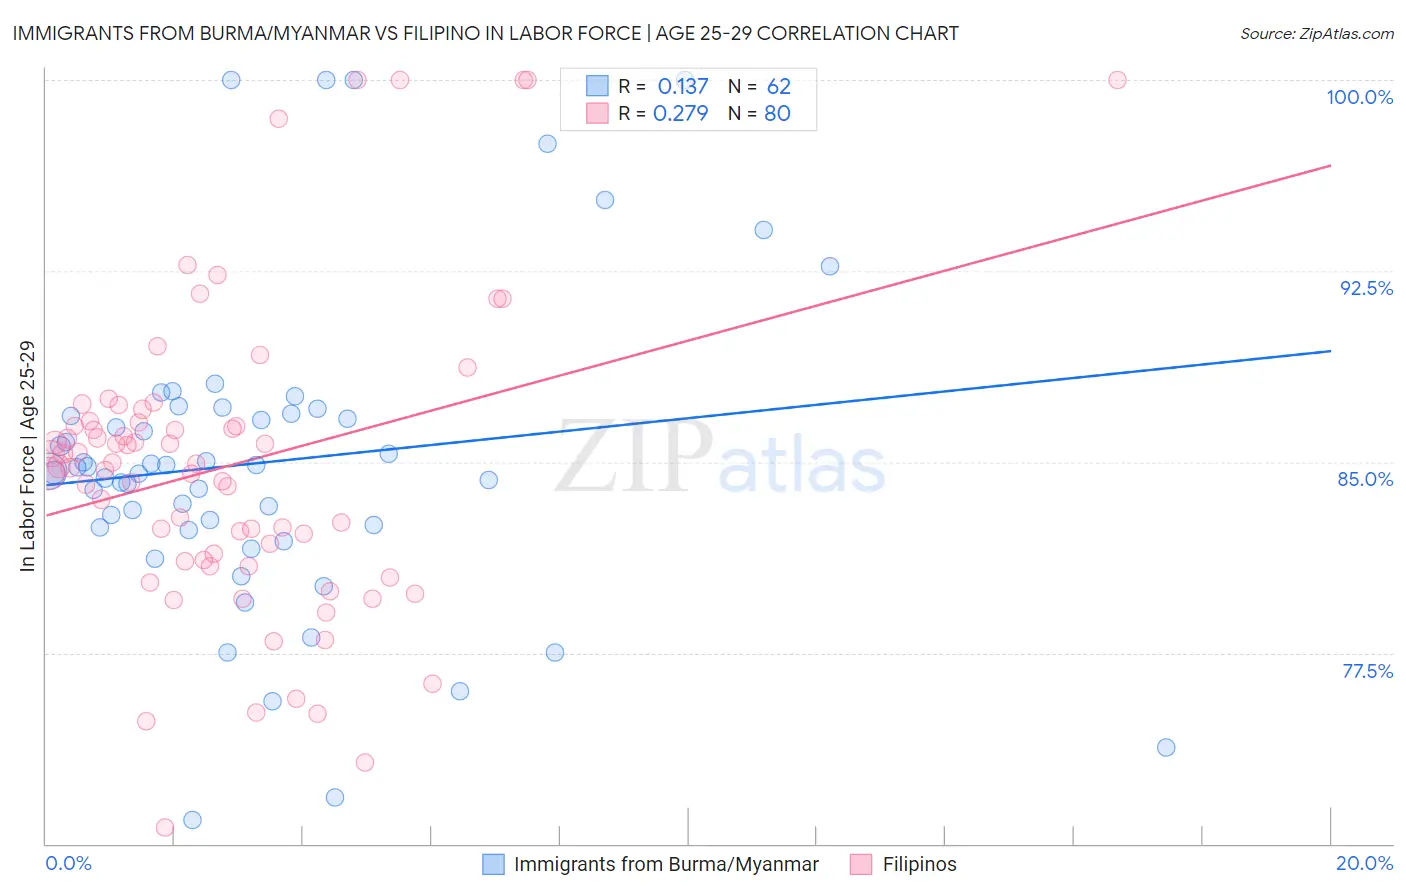
Immigrants from Burma/Myanmar vs Filipino In Labor Force | Age 25-29 Correlation Chart

The statistical analysis conducted on geographies consisting of 172,340,666 people shows a poor positive correlation between the proportion of Immigrants from Burma/Myanmar and labor force participation rate among population between the ages 25 and 29 in the United States with a correlation coefficient (R) of 0.137 and weighted average of 84.7%. Similarly, the statistical analysis conducted on geographies consisting of 254,306,648 people shows a weak positive correlation between the proportion of Filipinos and labor force participation rate among population between the ages 25 and 29 in the United States with a correlation coefficient (R) of 0.279 and weighted average of 84.9%, a difference of 0.30%.
Immigrants from Burma/Myanmar vs Filipino In Labor Force | Age 25-29

In Labor Force | Age 25-29 Correlation Summary

MeasurementImmigrants from Burma/MyanmarFilipino
Minimum70.9%70.6%
Maximum100.0%100.0%
Range29.1%29.4%
Mean85.0%84.8%
Median84.7%84.9%
Interquartile 25% (IQ1)82.4%81.1%
Interquartile 75% (IQ3)86.9%86.6%
Interquartile Range (IQR)4.5%5.5%
Standard Deviation (Sample)6.2%6.1%
Standard Deviation (Population)6.2%6.0%

Similar Demographics by In Labor Force | Age 25-29

Demographics Similar to Immigrants from Burma/Myanmar by In Labor Force | Age 25-29

In terms of in labor force | age 25-29, the demographic groups most similar to Immigrants from Burma/Myanmar are Argentinean (84.7%, a difference of 0.0%), Ghanaian (84.7%, a difference of 0.0%), Immigrants from Spain (84.7%, a difference of 0.0%), Immigrants from Peru (84.7%, a difference of 0.010%), and Canadian (84.7%, a difference of 0.010%).
DemographicsRating | RankIn Labor Force | Age 25-29
Immigrants | Ghana
60.2
/100
|
#158
Good
84.7%
Immigrants | Western Africa
60.1
/100
|
#159
Good
84.7%
Immigrants | Peru
58.6
/100
|
#160
Average
84.7%
Canadians
58.5
/100
|
#161
Average
84.7%
Immigrants | Colombia
58.3
/100
|
#162
Average
84.7%
Argentineans
57.9
/100
|
#163
Average
84.7%
Ghanaians
57.6
/100
|
#164
Average
84.7%
Immigrants | Burma/Myanmar
57.4
/100
|
#165
Average
84.7%
Immigrants | Spain
56.9
/100
|
#166
Average
84.7%
Indonesians
56.5
/100
|
#167
Average
84.7%
South Americans
54.9
/100
|
#168
Average
84.7%
Celtics
52.5
/100
|
#169
Average
84.7%
Tongans
52.4
/100
|
#170
Average
84.7%
Immigrants | Vietnam
50.5
/100
|
#171
Average
84.7%
Immigrants | Western Europe
50.4
/100
|
#172
Average
84.7%

Demographics Similar to Filipinos by In Labor Force | Age 25-29

In terms of in labor force | age 25-29, the demographic groups most similar to Filipinos are Immigrants from Belarus (85.0%, a difference of 0.010%), Finnish (85.0%, a difference of 0.010%), Immigrants from South Africa (84.9%, a difference of 0.020%), Immigrants from Chile (84.9%, a difference of 0.020%), and South African (85.0%, a difference of 0.030%).
DemographicsRating | RankIn Labor Force | Age 25-29
Senegalese
90.9
/100
|
#112
Exceptional
85.0%
Irish
90.6
/100
|
#113
Exceptional
85.0%
Immigrants | Malaysia
90.4
/100
|
#114
Exceptional
85.0%
South Africans
88.9
/100
|
#115
Excellent
85.0%
Chileans
88.8
/100
|
#116
Excellent
85.0%
Immigrants | Belarus
88.0
/100
|
#117
Excellent
85.0%
Finns
87.8
/100
|
#118
Excellent
85.0%
Filipinos
87.1
/100
|
#119
Excellent
84.9%
Immigrants | South Africa
86.1
/100
|
#120
Excellent
84.9%
Immigrants | Chile
85.6
/100
|
#121
Excellent
84.9%
Scandinavians
85.1
/100
|
#122
Excellent
84.9%
Dutch
84.9
/100
|
#123
Excellent
84.9%
Immigrants | Iran
84.8
/100
|
#124
Excellent
84.9%
Uruguayans
84.7
/100
|
#125
Excellent
84.9%
Immigrants | Singapore
84.4
/100
|
#126
Excellent
84.9%