Immigrants from Bangladesh vs Greek Median Family Income
COMPARE
Immigrants from Bangladesh
Greek
Median Family Income
Median Family Income Comparison
Immigrants from Bangladesh
Greeks
$94,665
MEDIAN FAMILY INCOME
1.6/ 100
METRIC RATING
233rd/ 347
METRIC RANK
$115,192
MEDIAN FAMILY INCOME
99.8/ 100
METRIC RATING
57th/ 347
METRIC RANK
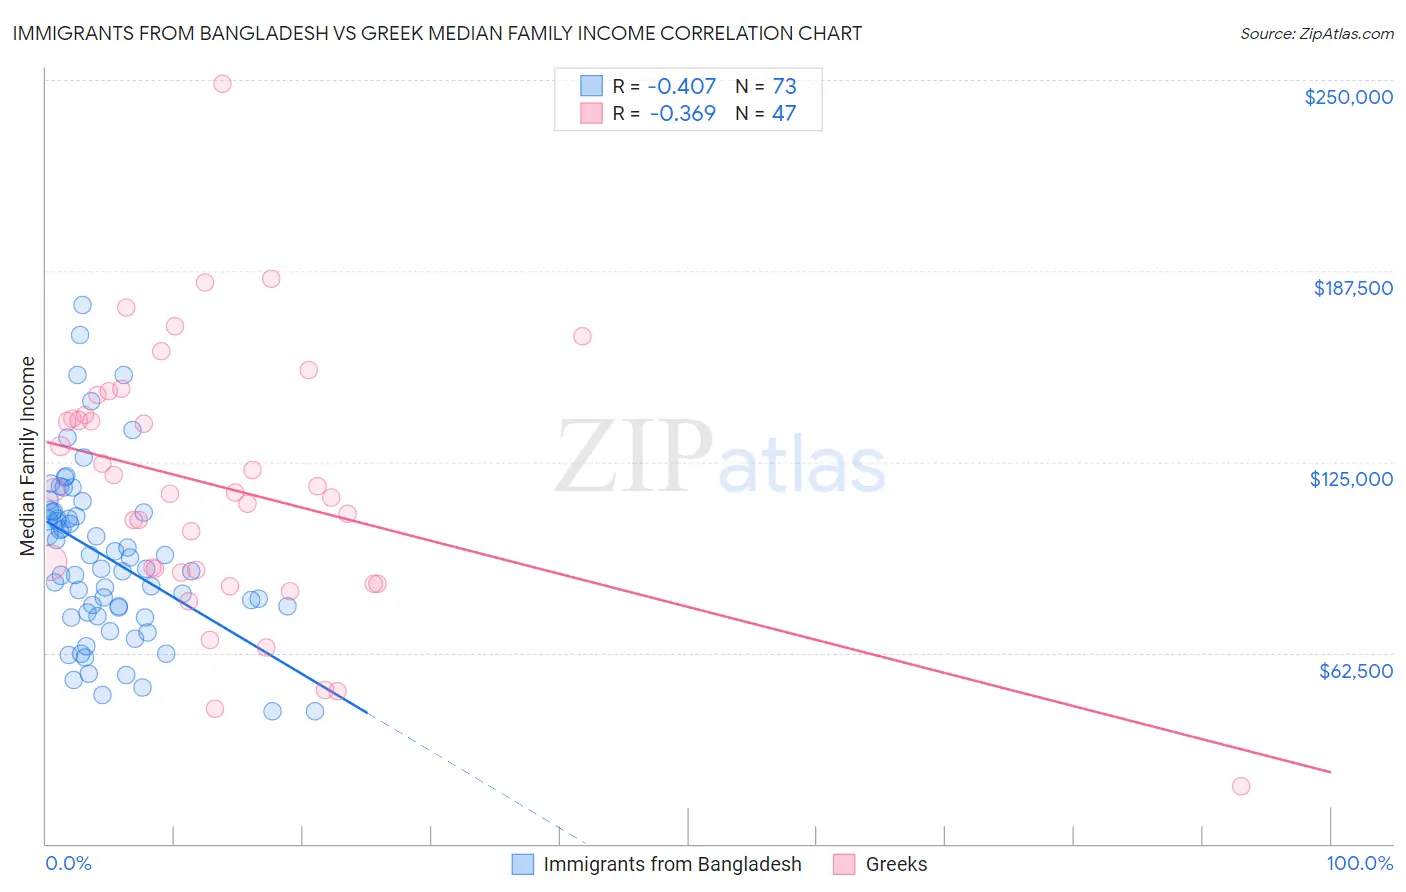
Immigrants from Bangladesh vs Greek Median Family Income Correlation Chart
The statistical analysis conducted on geographies consisting of 203,503,484 people shows a moderate negative correlation between the proportion of Immigrants from Bangladesh and median family income in the United States with a correlation coefficient (R) of -0.407 and weighted average of $94,665. Similarly, the statistical analysis conducted on geographies consisting of 482,131,670 people shows a mild negative correlation between the proportion of Greeks and median family income in the United States with a correlation coefficient (R) of -0.369 and weighted average of $115,192, a difference of 21.7%.
Median Family Income Correlation Summary
| Measurement | Immigrants from Bangladesh | Greek |
| Minimum | $43,315 | $18,825 |
| Maximum | $176,322 | $248,750 |
| Range | $133,007 | $229,925 |
| Mean | $93,798 | $116,811 |
| Median | $90,050 | $115,024 |
| Interquartile 25% (IQ1) | $75,060 | $88,890 |
| Interquartile 75% (IQ3) | $108,612 | $140,272 |
| Interquartile Range (IQR) | $33,553 | $51,382 |
| Standard Deviation (Sample) | $28,054 | $42,578 |
| Standard Deviation (Population) | $27,861 | $42,122 |
Similar Demographics by Median Family Income
Demographics Similar to Immigrants from Bangladesh by Median Family Income
In terms of median family income, the demographic groups most similar to Immigrants from Bangladesh are Immigrants from Western Africa ($94,638, a difference of 0.030%), Immigrants from Burma/Myanmar ($94,472, a difference of 0.20%), Trinidadian and Tobagonian ($94,466, a difference of 0.21%), Immigrants from Venezuela ($94,904, a difference of 0.25%), and Alaskan Athabascan ($94,429, a difference of 0.25%).
| Demographics | Rating | Rank | Median Family Income |
| Immigrants | Panama | 2.7 /100 | #226 | Tragic $95,647 |
| Alaska Natives | 2.6 /100 | #227 | Tragic $95,573 |
| Immigrants | Azores | 2.4 /100 | #228 | Tragic $95,402 |
| Marshallese | 2.2 /100 | #229 | Tragic $95,293 |
| Malaysians | 2.2 /100 | #230 | Tragic $95,230 |
| Ecuadorians | 2.1 /100 | #231 | Tragic $95,114 |
| Immigrants | Venezuela | 1.9 /100 | #232 | Tragic $94,904 |
| Immigrants | Bangladesh | 1.6 /100 | #233 | Tragic $94,665 |
| Immigrants | Western Africa | 1.6 /100 | #234 | Tragic $94,638 |
| Immigrants | Burma/Myanmar | 1.5 /100 | #235 | Tragic $94,472 |
| Trinidadians and Tobagonians | 1.5 /100 | #236 | Tragic $94,466 |
| Alaskan Athabascans | 1.5 /100 | #237 | Tragic $94,429 |
| Nepalese | 1.3 /100 | #238 | Tragic $94,153 |
| Salvadorans | 1.2 /100 | #239 | Tragic $94,109 |
| Somalis | 1.2 /100 | #240 | Tragic $94,085 |
Demographics Similar to Greeks by Median Family Income
In terms of median family income, the demographic groups most similar to Greeks are New Zealander ($115,230, a difference of 0.030%), Immigrants from Indonesia ($115,162, a difference of 0.030%), Lithuanian ($115,395, a difference of 0.18%), Immigrants from Netherlands ($114,987, a difference of 0.18%), and Immigrants from Europe ($115,523, a difference of 0.29%).
| Demographics | Rating | Rank | Median Family Income |
| Immigrants | Czechoslovakia | 99.9 /100 | #50 | Exceptional $116,165 |
| Immigrants | Malaysia | 99.9 /100 | #51 | Exceptional $115,880 |
| Maltese | 99.9 /100 | #52 | Exceptional $115,862 |
| Immigrants | Norway | 99.9 /100 | #53 | Exceptional $115,847 |
| Immigrants | Europe | 99.9 /100 | #54 | Exceptional $115,523 |
| Lithuanians | 99.8 /100 | #55 | Exceptional $115,395 |
| New Zealanders | 99.8 /100 | #56 | Exceptional $115,230 |
| Greeks | 99.8 /100 | #57 | Exceptional $115,192 |
| Immigrants | Indonesia | 99.8 /100 | #58 | Exceptional $115,162 |
| Immigrants | Netherlands | 99.8 /100 | #59 | Exceptional $114,987 |
| Immigrants | Latvia | 99.8 /100 | #60 | Exceptional $114,826 |
| Immigrants | Belarus | 99.8 /100 | #61 | Exceptional $114,586 |
| Mongolians | 99.8 /100 | #62 | Exceptional $114,553 |
| Immigrants | Pakistan | 99.8 /100 | #63 | Exceptional $114,406 |
| Immigrants | Scotland | 99.7 /100 | #64 | Exceptional $114,392 |