Immigrants from Bangladesh vs Greek Disability Age 35 to 64
COMPARE
Immigrants from Bangladesh
Greek
Disability Age 35 to 64
Disability Age 35 to 64 Comparison
Immigrants from Bangladesh
Greeks
10.9%
DISABILITY AGE 35 TO 64
85.6/ 100
METRIC RATING
145th/ 347
METRIC RANK
10.7%
DISABILITY AGE 35 TO 64
92.3/ 100
METRIC RATING
135th/ 347
METRIC RANK
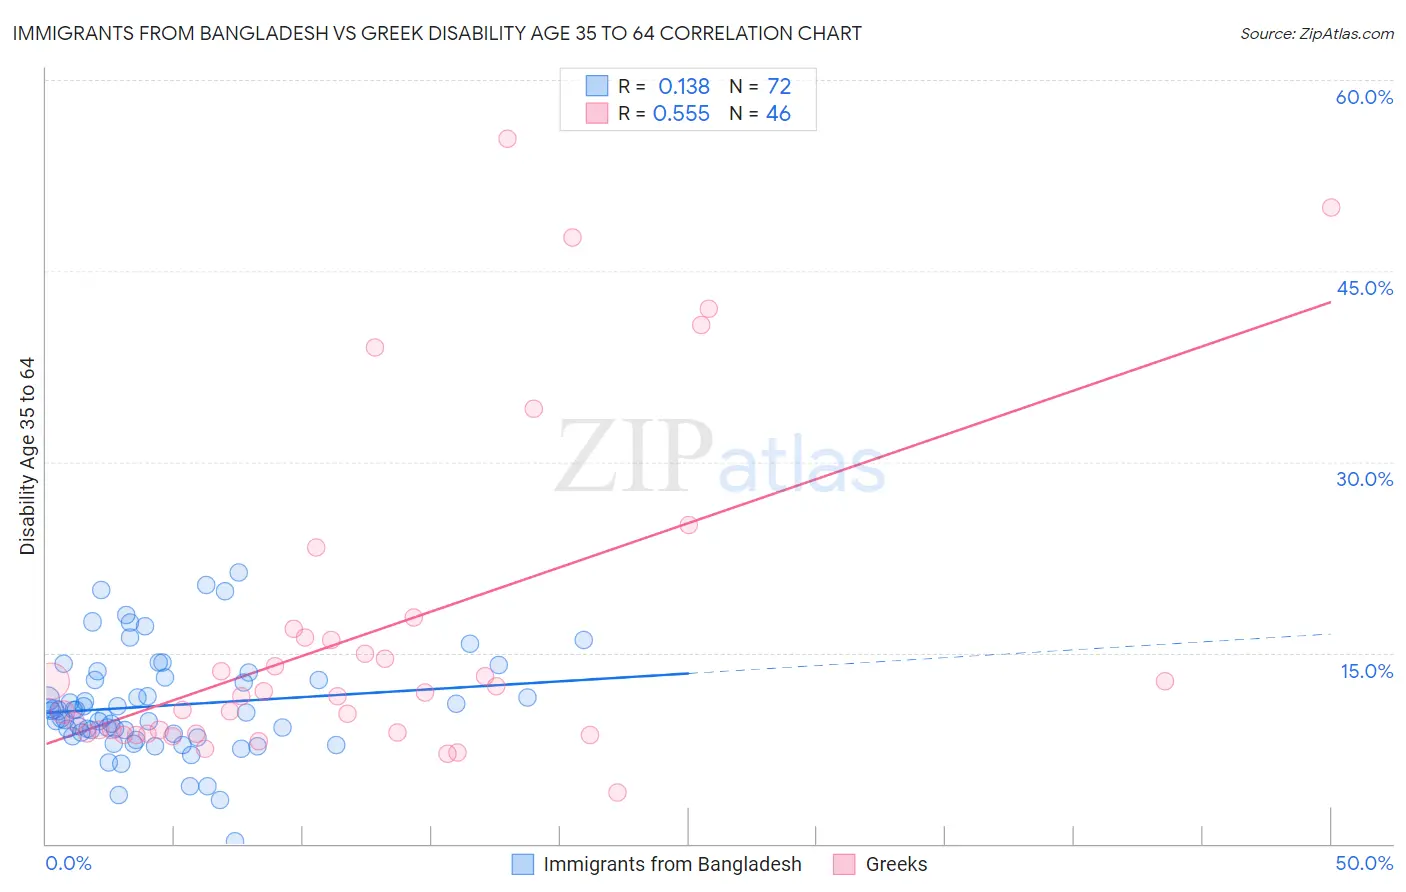
Immigrants from Bangladesh vs Greek Disability Age 35 to 64 Correlation Chart
The statistical analysis conducted on geographies consisting of 203,551,406 people shows a poor positive correlation between the proportion of Immigrants from Bangladesh and percentage of population with a disability between the ages 34 and 64 in the United States with a correlation coefficient (R) of 0.138 and weighted average of 10.9%. Similarly, the statistical analysis conducted on geographies consisting of 482,222,080 people shows a substantial positive correlation between the proportion of Greeks and percentage of population with a disability between the ages 34 and 64 in the United States with a correlation coefficient (R) of 0.555 and weighted average of 10.7%, a difference of 1.5%.
Disability Age 35 to 64 Correlation Summary
| Measurement | Immigrants from Bangladesh | Greek |
| Minimum | 0.20% | 4.0% |
| Maximum | 21.3% | 55.4% |
| Range | 21.1% | 51.4% |
| Mean | 10.9% | 16.5% |
| Median | 10.4% | 11.8% |
| Interquartile 25% (IQ1) | 8.5% | 8.7% |
| Interquartile 75% (IQ3) | 12.9% | 16.2% |
| Interquartile Range (IQR) | 4.4% | 7.5% |
| Standard Deviation (Sample) | 4.1% | 12.7% |
| Standard Deviation (Population) | 4.1% | 12.6% |
Demographics Similar to Immigrants from Bangladesh and Greeks by Disability Age 35 to 64
In terms of disability age 35 to 64, the demographic groups most similar to Immigrants from Bangladesh are South American Indian (10.9%, a difference of 0.34%), Immigrants from Eritrea (10.9%, a difference of 0.36%), Arab (10.9%, a difference of 0.45%), Lithuanian (10.8%, a difference of 0.58%), and Immigrants from Cameroon (10.9%, a difference of 0.68%). Similarly, the demographic groups most similar to Greeks are Immigrants from Albania (10.7%, a difference of 0.050%), Immigrants (10.7%, a difference of 0.050%), Immigrants from Ecuador (10.7%, a difference of 0.050%), Salvadoran (10.7%, a difference of 0.11%), and Immigrants from El Salvador (10.7%, a difference of 0.16%).
| Demographics | Rating | Rank | Disability Age 35 to 64 |
| Immigrants | Syria | 93.0 /100 | #130 | Exceptional 10.7% |
| Immigrants | El Salvador | 92.8 /100 | #131 | Exceptional 10.7% |
| Immigrants | Albania | 92.5 /100 | #132 | Exceptional 10.7% |
| Immigrants | Immigrants | 92.5 /100 | #133 | Exceptional 10.7% |
| Immigrants | Ecuador | 92.5 /100 | #134 | Exceptional 10.7% |
| Greeks | 92.3 /100 | #135 | Exceptional 10.7% |
| Salvadorans | 91.9 /100 | #136 | Exceptional 10.7% |
| Immigrants | Costa Rica | 91.7 /100 | #137 | Exceptional 10.7% |
| Immigrants | Southern Europe | 91.5 /100 | #138 | Exceptional 10.7% |
| Costa Ricans | 91.4 /100 | #139 | Exceptional 10.7% |
| Immigrants | Scotland | 91.3 /100 | #140 | Exceptional 10.7% |
| Australians | 90.7 /100 | #141 | Exceptional 10.8% |
| Immigrants | Saudi Arabia | 90.6 /100 | #142 | Exceptional 10.8% |
| Sierra Leoneans | 89.7 /100 | #143 | Excellent 10.8% |
| Lithuanians | 88.7 /100 | #144 | Excellent 10.8% |
| Immigrants | Bangladesh | 85.6 /100 | #145 | Excellent 10.9% |
| South American Indians | 83.5 /100 | #146 | Excellent 10.9% |
| Immigrants | Eritrea | 83.4 /100 | #147 | Excellent 10.9% |
| Arabs | 82.7 /100 | #148 | Excellent 10.9% |
| Immigrants | Cameroon | 81.1 /100 | #149 | Excellent 10.9% |
| Syrians | 79.8 /100 | #150 | Good 11.0% |