Immigrants from South Africa vs Greek Median Family Income
COMPARE
Immigrants from South Africa
Greek
Median Family Income
Median Family Income Comparison
Immigrants from South Africa
Greeks
$116,286
MEDIAN FAMILY INCOME
99.9/ 100
METRIC RATING
48th/ 347
METRIC RANK
$115,192
MEDIAN FAMILY INCOME
99.8/ 100
METRIC RATING
57th/ 347
METRIC RANK
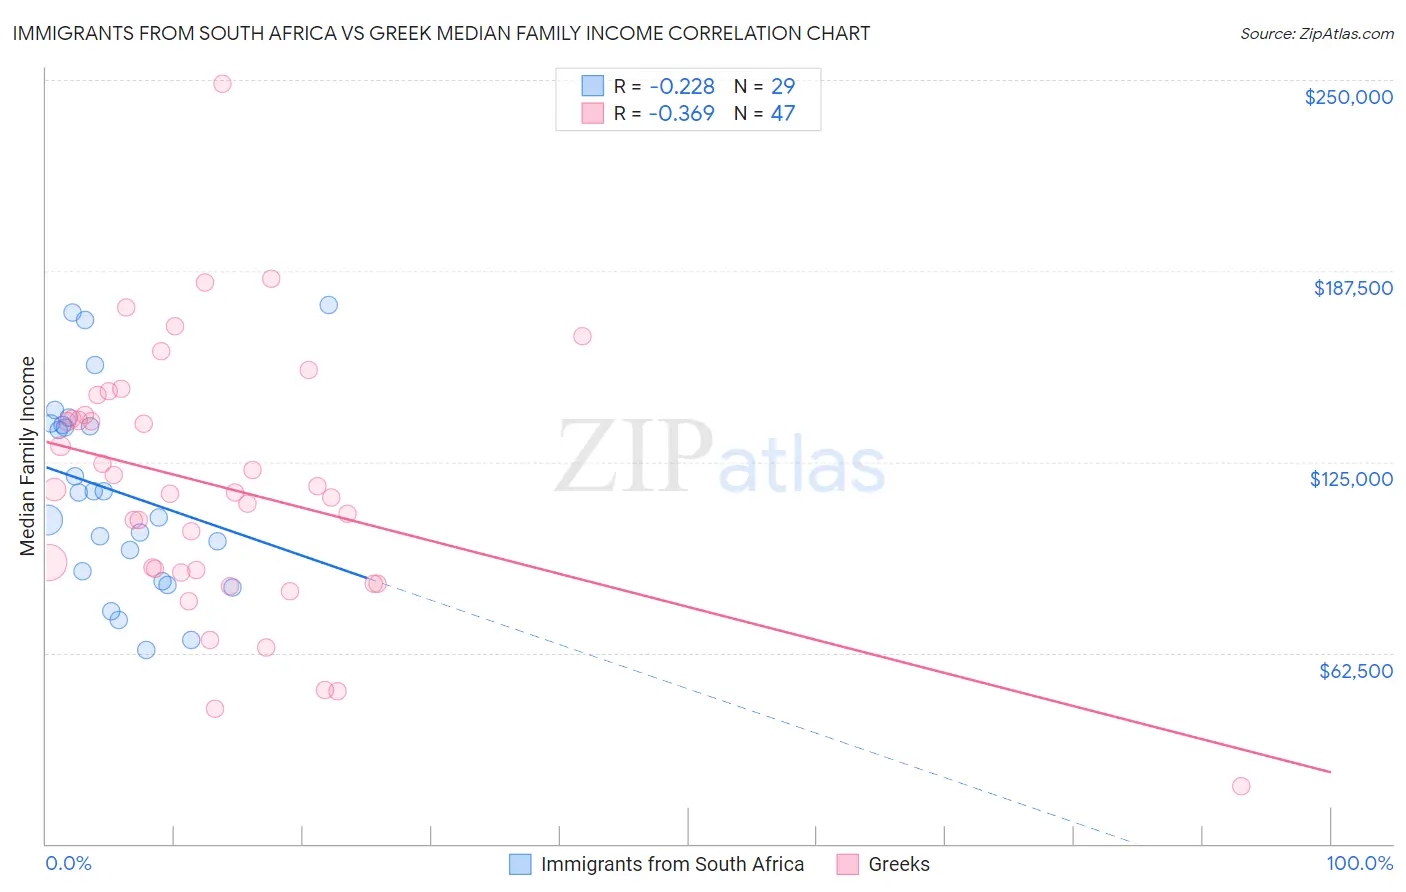
Immigrants from South Africa vs Greek Median Family Income Correlation Chart
The statistical analysis conducted on geographies consisting of 233,253,527 people shows a weak negative correlation between the proportion of Immigrants from South Africa and median family income in the United States with a correlation coefficient (R) of -0.228 and weighted average of $116,286. Similarly, the statistical analysis conducted on geographies consisting of 482,131,670 people shows a mild negative correlation between the proportion of Greeks and median family income in the United States with a correlation coefficient (R) of -0.369 and weighted average of $115,192, a difference of 0.95%.
Median Family Income Correlation Summary
| Measurement | Immigrants from South Africa | Greek |
| Minimum | $63,496 | $18,825 |
| Maximum | $176,195 | $248,750 |
| Range | $112,699 | $229,925 |
| Mean | $115,244 | $116,811 |
| Median | $114,820 | $115,024 |
| Interquartile 25% (IQ1) | $87,615 | $88,890 |
| Interquartile 75% (IQ3) | $137,250 | $140,272 |
| Interquartile Range (IQR) | $49,635 | $51,382 |
| Standard Deviation (Sample) | $31,957 | $42,578 |
| Standard Deviation (Population) | $31,402 | $42,122 |
Demographics Similar to Immigrants from South Africa and Greeks by Median Family Income
In terms of median family income, the demographic groups most similar to Immigrants from South Africa are Chinese ($116,188, a difference of 0.080%), Immigrants from Czechoslovakia ($116,165, a difference of 0.10%), Immigrants from Malaysia ($115,880, a difference of 0.35%), Maltese ($115,862, a difference of 0.37%), and Immigrants from Norway ($115,847, a difference of 0.38%). Similarly, the demographic groups most similar to Greeks are New Zealander ($115,230, a difference of 0.030%), Immigrants from Indonesia ($115,162, a difference of 0.030%), Lithuanian ($115,395, a difference of 0.18%), Immigrants from Netherlands ($114,987, a difference of 0.18%), and Immigrants from Europe ($115,523, a difference of 0.29%).
| Demographics | Rating | Rank | Median Family Income |
| Immigrants | Bolivia | 100.0 /100 | #42 | Exceptional $117,912 |
| Bulgarians | 100.0 /100 | #43 | Exceptional $117,818 |
| Cambodians | 100.0 /100 | #44 | Exceptional $117,780 |
| Immigrants | Greece | 99.9 /100 | #45 | Exceptional $117,344 |
| Immigrants | Russia | 99.9 /100 | #46 | Exceptional $116,942 |
| Immigrants | Austria | 99.9 /100 | #47 | Exceptional $116,830 |
| Immigrants | South Africa | 99.9 /100 | #48 | Exceptional $116,286 |
| Chinese | 99.9 /100 | #49 | Exceptional $116,188 |
| Immigrants | Czechoslovakia | 99.9 /100 | #50 | Exceptional $116,165 |
| Immigrants | Malaysia | 99.9 /100 | #51 | Exceptional $115,880 |
| Maltese | 99.9 /100 | #52 | Exceptional $115,862 |
| Immigrants | Norway | 99.9 /100 | #53 | Exceptional $115,847 |
| Immigrants | Europe | 99.9 /100 | #54 | Exceptional $115,523 |
| Lithuanians | 99.8 /100 | #55 | Exceptional $115,395 |
| New Zealanders | 99.8 /100 | #56 | Exceptional $115,230 |
| Greeks | 99.8 /100 | #57 | Exceptional $115,192 |
| Immigrants | Indonesia | 99.8 /100 | #58 | Exceptional $115,162 |
| Immigrants | Netherlands | 99.8 /100 | #59 | Exceptional $114,987 |
| Immigrants | Latvia | 99.8 /100 | #60 | Exceptional $114,826 |
| Immigrants | Belarus | 99.8 /100 | #61 | Exceptional $114,586 |
| Mongolians | 99.8 /100 | #62 | Exceptional $114,553 |