Hmong vs Ottawa Median Family Income
COMPARE
Hmong
Ottawa
Median Family Income
Median Family Income Comparison
Hmong
Ottawa
$91,296
MEDIAN FAMILY INCOME
0.3/ 100
METRIC RATING
265th/ 347
METRIC RANK
$86,380
MEDIAN FAMILY INCOME
0.0/ 100
METRIC RATING
300th/ 347
METRIC RANK
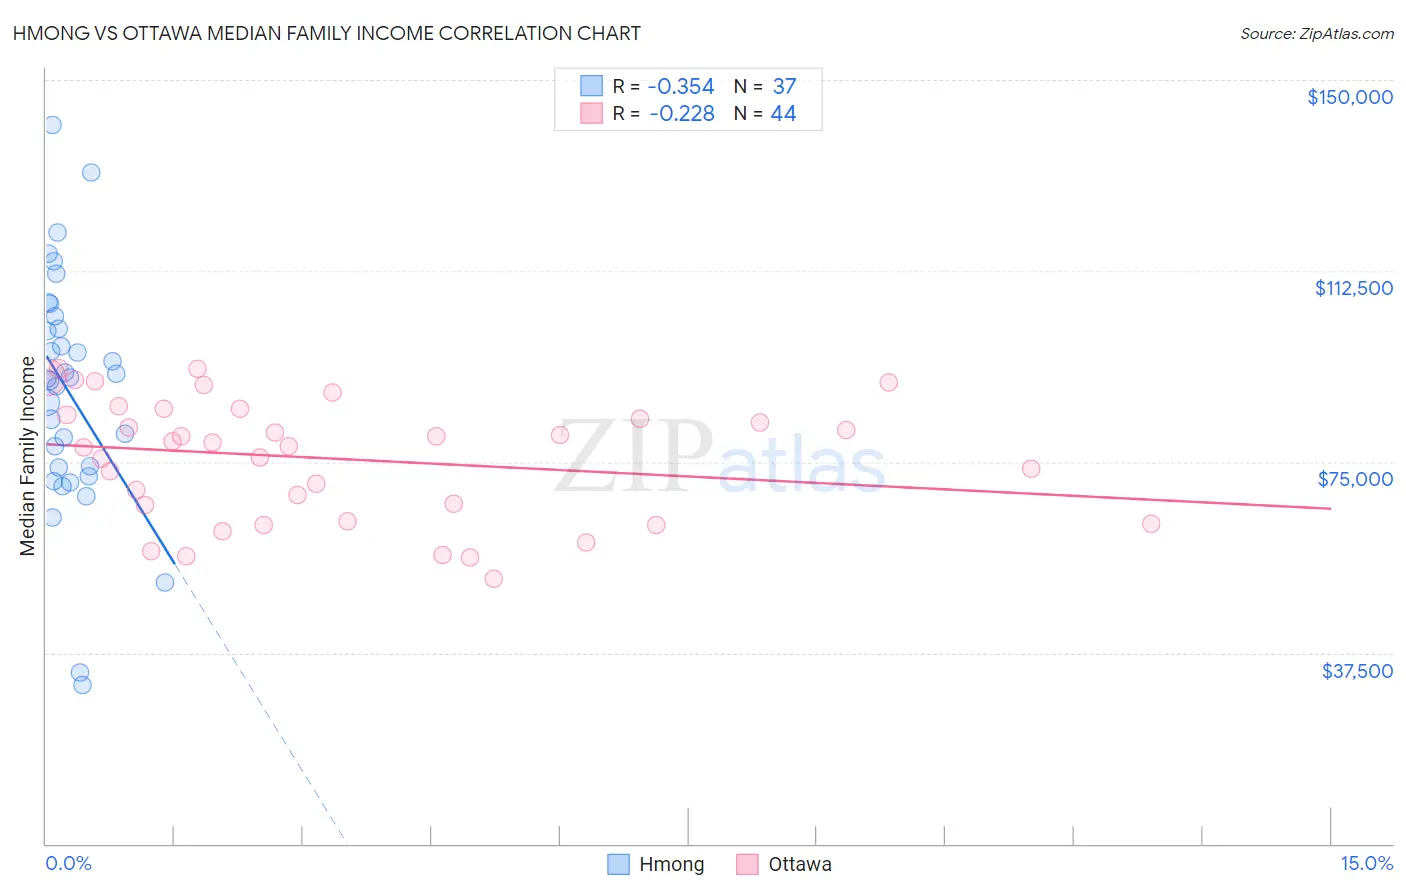
Hmong vs Ottawa Median Family Income Correlation Chart
The statistical analysis conducted on geographies consisting of 24,655,529 people shows a mild negative correlation between the proportion of Hmong and median family income in the United States with a correlation coefficient (R) of -0.354 and weighted average of $91,296. Similarly, the statistical analysis conducted on geographies consisting of 49,943,189 people shows a weak negative correlation between the proportion of Ottawa and median family income in the United States with a correlation coefficient (R) of -0.228 and weighted average of $86,380, a difference of 5.7%.
Median Family Income Correlation Summary
| Measurement | Hmong | Ottawa |
| Minimum | $31,056 | $52,125 |
| Maximum | $141,078 | $93,380 |
| Range | $110,022 | $41,255 |
| Mean | $88,552 | $75,597 |
| Median | $91,363 | $78,416 |
| Interquartile 25% (IQ1) | $73,027 | $64,972 |
| Interquartile 75% (IQ3) | $102,409 | $84,864 |
| Interquartile Range (IQR) | $29,382 | $19,892 |
| Standard Deviation (Sample) | $23,412 | $11,825 |
| Standard Deviation (Population) | $23,093 | $11,690 |
Similar Demographics by Median Family Income
Demographics Similar to Hmong by Median Family Income
In terms of median family income, the demographic groups most similar to Hmong are Senegalese ($91,475, a difference of 0.20%), Central American ($91,087, a difference of 0.23%), Immigrants from West Indies ($91,588, a difference of 0.32%), Mexican American Indian ($90,918, a difference of 0.42%), and Cree ($90,882, a difference of 0.46%).
| Demographics | Rating | Rank | Median Family Income |
| Osage | 0.4 /100 | #258 | Tragic $91,926 |
| Cape Verdeans | 0.4 /100 | #259 | Tragic $91,848 |
| Pennsylvania Germans | 0.4 /100 | #260 | Tragic $91,763 |
| Inupiat | 0.4 /100 | #261 | Tragic $91,730 |
| Liberians | 0.4 /100 | #262 | Tragic $91,722 |
| Immigrants | West Indies | 0.3 /100 | #263 | Tragic $91,588 |
| Senegalese | 0.3 /100 | #264 | Tragic $91,475 |
| Hmong | 0.3 /100 | #265 | Tragic $91,296 |
| Central Americans | 0.3 /100 | #266 | Tragic $91,087 |
| Mexican American Indians | 0.2 /100 | #267 | Tragic $90,918 |
| Cree | 0.2 /100 | #268 | Tragic $90,882 |
| Belizeans | 0.2 /100 | #269 | Tragic $90,880 |
| Jamaicans | 0.2 /100 | #270 | Tragic $90,581 |
| Iroquois | 0.2 /100 | #271 | Tragic $90,543 |
| Immigrants | Liberia | 0.2 /100 | #272 | Tragic $90,450 |
Demographics Similar to Ottawa by Median Family Income
In terms of median family income, the demographic groups most similar to Ottawa are Chippewa ($86,852, a difference of 0.55%), Colville ($85,792, a difference of 0.69%), Immigrants from Latin America ($86,989, a difference of 0.71%), Spanish American Indian ($85,728, a difference of 0.76%), and Hispanic or Latino ($85,647, a difference of 0.86%).
| Demographics | Rating | Rank | Median Family Income |
| Ute | 0.0 /100 | #293 | Tragic $87,596 |
| Fijians | 0.0 /100 | #294 | Tragic $87,387 |
| Yaqui | 0.0 /100 | #295 | Tragic $87,289 |
| Immigrants | Guatemala | 0.0 /100 | #296 | Tragic $87,191 |
| Cajuns | 0.0 /100 | #297 | Tragic $87,157 |
| Immigrants | Latin America | 0.0 /100 | #298 | Tragic $86,989 |
| Chippewa | 0.0 /100 | #299 | Tragic $86,852 |
| Ottawa | 0.0 /100 | #300 | Tragic $86,380 |
| Colville | 0.0 /100 | #301 | Tragic $85,792 |
| Spanish American Indians | 0.0 /100 | #302 | Tragic $85,728 |
| Hispanics or Latinos | 0.0 /100 | #303 | Tragic $85,647 |
| Mexicans | 0.0 /100 | #304 | Tragic $85,618 |
| Paiute | 0.0 /100 | #305 | Tragic $85,414 |
| Immigrants | Dominica | 0.0 /100 | #306 | Tragic $85,411 |
| Chickasaw | 0.0 /100 | #307 | Tragic $85,356 |