Haitian vs Immigrants from Chile Per Capita Income
COMPARE
Haitian
Immigrants from Chile
Per Capita Income
Per Capita Income Comparison
Haitians
Immigrants from Chile
$37,289
PER CAPITA INCOME
0.1/ 100
METRIC RATING
297th/ 347
METRIC RANK
$46,213
PER CAPITA INCOME
94.6/ 100
METRIC RATING
115th/ 347
METRIC RANK
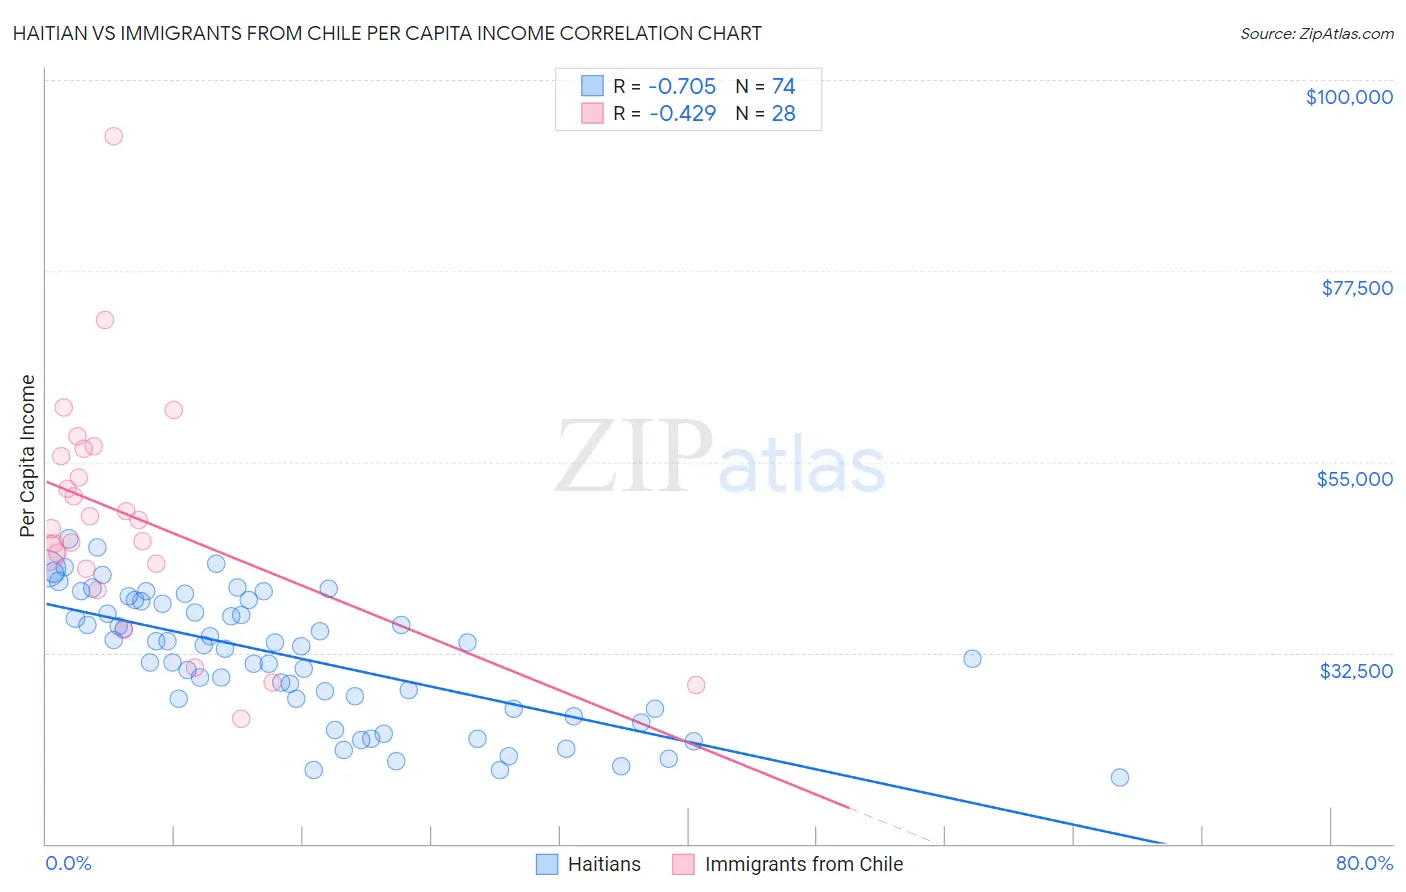
Haitian vs Immigrants from Chile Per Capita Income Correlation Chart
The statistical analysis conducted on geographies consisting of 288,031,086 people shows a strong negative correlation between the proportion of Haitians and per capita income in the United States with a correlation coefficient (R) of -0.705 and weighted average of $37,289. Similarly, the statistical analysis conducted on geographies consisting of 218,646,729 people shows a moderate negative correlation between the proportion of Immigrants from Chile and per capita income in the United States with a correlation coefficient (R) of -0.429 and weighted average of $46,213, a difference of 23.9%.
Per Capita Income Correlation Summary
| Measurement | Haitian | Immigrants from Chile |
| Minimum | $17,858 | $24,660 |
| Maximum | $45,871 | $93,304 |
| Range | $28,013 | $68,644 |
| Mean | $31,987 | $48,666 |
| Median | $33,320 | $47,656 |
| Interquartile 25% (IQ1) | $25,885 | $42,721 |
| Interquartile 75% (IQ3) | $38,541 | $56,086 |
| Interquartile Range (IQR) | $12,656 | $13,365 |
| Standard Deviation (Sample) | $7,480 | $13,904 |
| Standard Deviation (Population) | $7,429 | $13,654 |
Similar Demographics by Per Capita Income
Demographics Similar to Haitians by Per Capita Income
In terms of per capita income, the demographic groups most similar to Haitians are Indonesian ($37,300, a difference of 0.030%), Immigrants from Dominican Republic ($37,306, a difference of 0.040%), Immigrants from Caribbean ($37,254, a difference of 0.090%), Cherokee ($37,203, a difference of 0.23%), and Cuban ($37,383, a difference of 0.25%).
| Demographics | Rating | Rank | Per Capita Income |
| Immigrants | Guatemala | 0.1 /100 | #290 | Tragic $37,550 |
| Cajuns | 0.1 /100 | #291 | Tragic $37,527 |
| Immigrants | Micronesia | 0.1 /100 | #292 | Tragic $37,464 |
| Mexican American Indians | 0.1 /100 | #293 | Tragic $37,407 |
| Cubans | 0.1 /100 | #294 | Tragic $37,383 |
| Immigrants | Dominican Republic | 0.1 /100 | #295 | Tragic $37,306 |
| Indonesians | 0.1 /100 | #296 | Tragic $37,300 |
| Haitians | 0.1 /100 | #297 | Tragic $37,289 |
| Immigrants | Caribbean | 0.1 /100 | #298 | Tragic $37,254 |
| Cherokee | 0.1 /100 | #299 | Tragic $37,203 |
| Immigrants | Bahamas | 0.1 /100 | #300 | Tragic $37,193 |
| Ottawa | 0.1 /100 | #301 | Tragic $37,101 |
| Shoshone | 0.1 /100 | #302 | Tragic $37,072 |
| Paiute | 0.1 /100 | #303 | Tragic $37,066 |
| Hondurans | 0.1 /100 | #304 | Tragic $37,031 |
Demographics Similar to Immigrants from Chile by Per Capita Income
In terms of per capita income, the demographic groups most similar to Immigrants from Chile are Afghan ($46,268, a difference of 0.12%), Polish ($46,123, a difference of 0.20%), Chinese ($46,098, a difference of 0.25%), Immigrants from Albania ($46,387, a difference of 0.38%), and Immigrants from Saudi Arabia ($46,008, a difference of 0.45%).
| Demographics | Rating | Rank | Per Capita Income |
| Immigrants | Kuwait | 96.2 /100 | #108 | Exceptional $46,543 |
| Immigrants | Northern Africa | 96.2 /100 | #109 | Exceptional $46,531 |
| Chileans | 95.9 /100 | #110 | Exceptional $46,459 |
| Taiwanese | 95.8 /100 | #111 | Exceptional $46,455 |
| Immigrants | Morocco | 95.7 /100 | #112 | Exceptional $46,430 |
| Immigrants | Albania | 95.5 /100 | #113 | Exceptional $46,387 |
| Afghans | 94.9 /100 | #114 | Exceptional $46,268 |
| Immigrants | Chile | 94.6 /100 | #115 | Exceptional $46,213 |
| Poles | 94.1 /100 | #116 | Exceptional $46,123 |
| Chinese | 93.9 /100 | #117 | Exceptional $46,098 |
| Immigrants | Saudi Arabia | 93.3 /100 | #118 | Exceptional $46,008 |
| Immigrants | Poland | 93.1 /100 | #119 | Exceptional $45,979 |
| Immigrants | Ethiopia | 92.7 /100 | #120 | Exceptional $45,923 |
| Canadians | 92.2 /100 | #121 | Exceptional $45,858 |
| Moroccans | 92.1 /100 | #122 | Exceptional $45,854 |