Guatemalan vs Sierra Leonean Median Family Income
COMPARE
Guatemalan
Sierra Leonean
Median Family Income
Median Family Income Comparison
Guatemalans
Sierra Leoneans
$88,295
MEDIAN FAMILY INCOME
0.1/ 100
METRIC RATING
285th/ 347
METRIC RANK
$103,859
MEDIAN FAMILY INCOME
64.7/ 100
METRIC RATING
164th/ 347
METRIC RANK
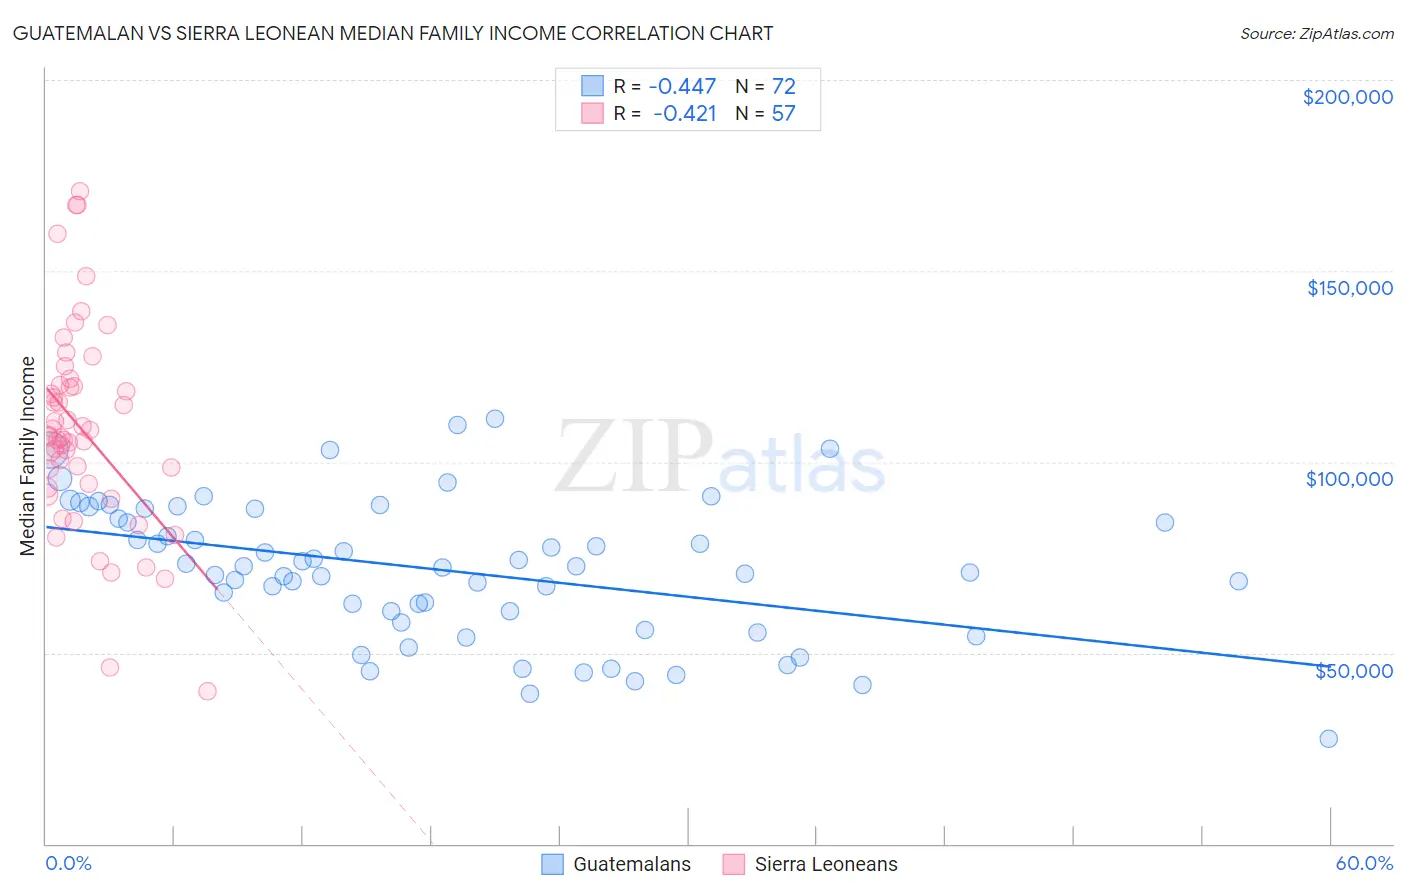
Guatemalan vs Sierra Leonean Median Family Income Correlation Chart
The statistical analysis conducted on geographies consisting of 409,160,818 people shows a moderate negative correlation between the proportion of Guatemalans and median family income in the United States with a correlation coefficient (R) of -0.447 and weighted average of $88,295. Similarly, the statistical analysis conducted on geographies consisting of 83,335,449 people shows a moderate negative correlation between the proportion of Sierra Leoneans and median family income in the United States with a correlation coefficient (R) of -0.421 and weighted average of $103,859, a difference of 17.6%.
Median Family Income Correlation Summary
| Measurement | Guatemalan | Sierra Leonean |
| Minimum | $27,406 | $39,837 |
| Maximum | $111,362 | $170,916 |
| Range | $83,956 | $131,079 |
| Mean | $71,713 | $108,328 |
| Median | $72,451 | $106,551 |
| Interquartile 25% (IQ1) | $59,369 | $93,816 |
| Interquartile 75% (IQ3) | $86,431 | $120,017 |
| Interquartile Range (IQR) | $27,062 | $26,201 |
| Standard Deviation (Sample) | $18,247 | $26,389 |
| Standard Deviation (Population) | $18,120 | $26,156 |
Similar Demographics by Median Family Income
Demographics Similar to Guatemalans by Median Family Income
In terms of median family income, the demographic groups most similar to Guatemalans are Indonesian ($88,301, a difference of 0.010%), Immigrants from Nicaragua ($88,267, a difference of 0.030%), Potawatomi ($88,265, a difference of 0.030%), Bangladeshi ($88,358, a difference of 0.070%), and Cherokee ($88,209, a difference of 0.10%).
| Demographics | Rating | Rank | Median Family Income |
| Immigrants | Grenada | 0.1 /100 | #278 | Tragic $89,249 |
| Immigrants | Belize | 0.1 /100 | #279 | Tragic $89,197 |
| British West Indians | 0.1 /100 | #280 | Tragic $88,987 |
| Blackfeet | 0.1 /100 | #281 | Tragic $88,717 |
| Comanche | 0.1 /100 | #282 | Tragic $88,556 |
| Bangladeshis | 0.1 /100 | #283 | Tragic $88,358 |
| Indonesians | 0.1 /100 | #284 | Tragic $88,301 |
| Guatemalans | 0.1 /100 | #285 | Tragic $88,295 |
| Immigrants | Nicaragua | 0.1 /100 | #286 | Tragic $88,267 |
| Potawatomi | 0.1 /100 | #287 | Tragic $88,265 |
| Cherokee | 0.1 /100 | #288 | Tragic $88,209 |
| Central American Indians | 0.1 /100 | #289 | Tragic $88,034 |
| Shoshone | 0.1 /100 | #290 | Tragic $87,872 |
| Immigrants | Cabo Verde | 0.1 /100 | #291 | Tragic $87,830 |
| Africans | 0.1 /100 | #292 | Tragic $87,820 |
Demographics Similar to Sierra Leoneans by Median Family Income
In terms of median family income, the demographic groups most similar to Sierra Leoneans are Immigrants from Sierra Leone ($103,990, a difference of 0.13%), Costa Rican ($103,989, a difference of 0.13%), Slovak ($103,729, a difference of 0.13%), English ($103,684, a difference of 0.17%), and South American Indian ($103,624, a difference of 0.23%).
| Demographics | Rating | Rank | Median Family Income |
| Moroccans | 71.6 /100 | #157 | Good $104,488 |
| Scandinavians | 70.8 /100 | #158 | Good $104,410 |
| Swiss | 70.7 /100 | #159 | Good $104,396 |
| Scottish | 69.5 /100 | #160 | Good $104,288 |
| Icelanders | 69.4 /100 | #161 | Good $104,282 |
| Immigrants | Sierra Leone | 66.2 /100 | #162 | Good $103,990 |
| Costa Ricans | 66.2 /100 | #163 | Good $103,989 |
| Sierra Leoneans | 64.7 /100 | #164 | Good $103,859 |
| Slovaks | 63.1 /100 | #165 | Good $103,729 |
| English | 62.6 /100 | #166 | Good $103,684 |
| South American Indians | 61.9 /100 | #167 | Good $103,624 |
| Immigrants | Peru | 60.8 /100 | #168 | Good $103,534 |
| Czechoslovakians | 57.6 /100 | #169 | Average $103,273 |
| Immigrants | Uzbekistan | 56.6 /100 | #170 | Average $103,197 |
| Alsatians | 54.3 /100 | #171 | Average $103,010 |