Guatemalan vs Yakama Median Family Income
COMPARE
Guatemalan
Yakama
Median Family Income
Median Family Income Comparison
Guatemalans
Yakama
$88,295
MEDIAN FAMILY INCOME
0.1/ 100
METRIC RATING
285th/ 347
METRIC RANK
$83,932
MEDIAN FAMILY INCOME
0.0/ 100
METRIC RATING
317th/ 347
METRIC RANK
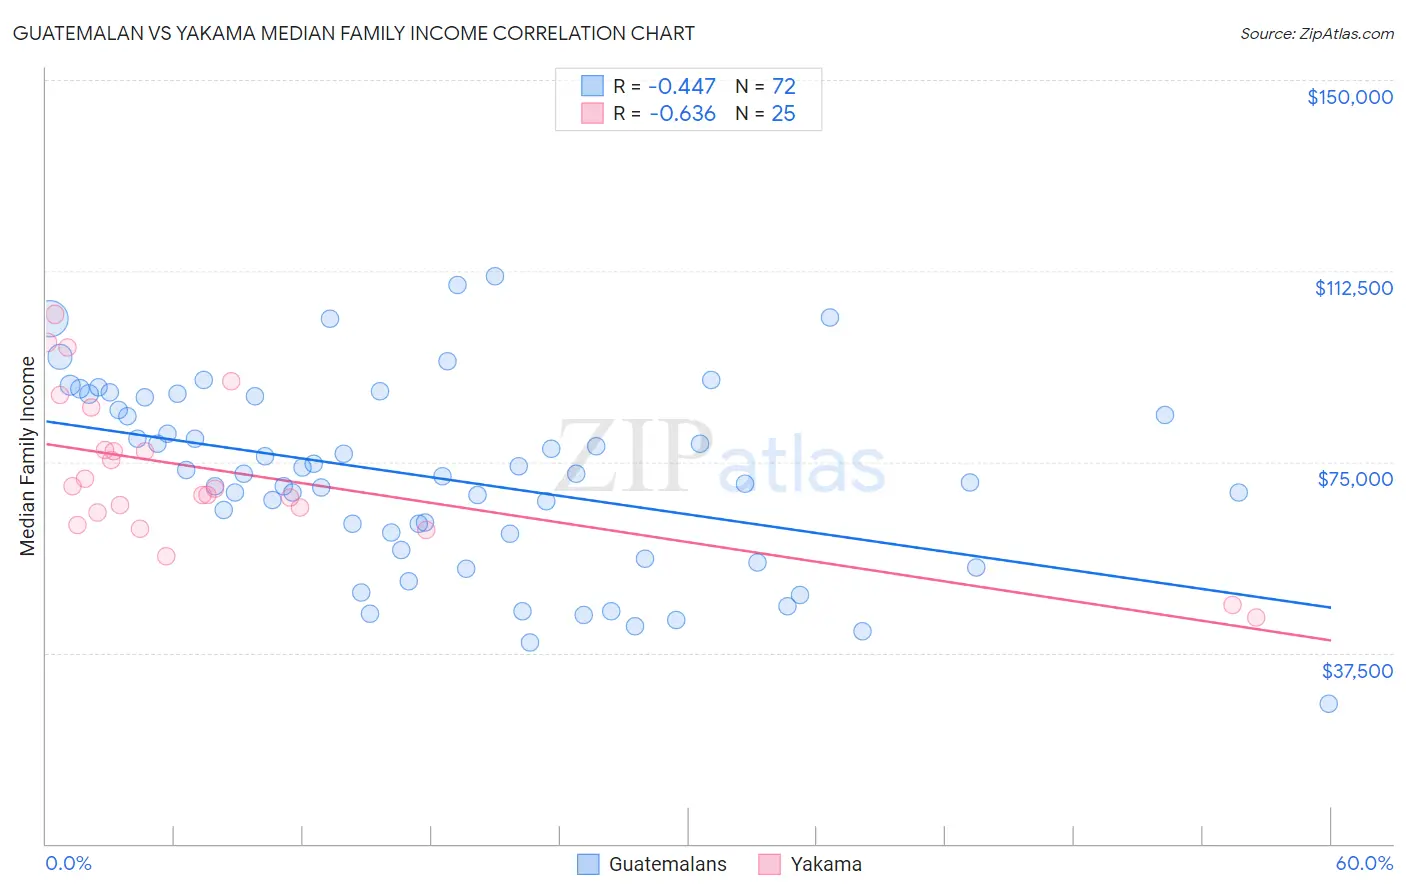
Guatemalan vs Yakama Median Family Income Correlation Chart
The statistical analysis conducted on geographies consisting of 409,160,818 people shows a moderate negative correlation between the proportion of Guatemalans and median family income in the United States with a correlation coefficient (R) of -0.447 and weighted average of $88,295. Similarly, the statistical analysis conducted on geographies consisting of 19,915,987 people shows a significant negative correlation between the proportion of Yakama and median family income in the United States with a correlation coefficient (R) of -0.636 and weighted average of $83,932, a difference of 5.2%.
Median Family Income Correlation Summary
| Measurement | Guatemalan | Yakama |
| Minimum | $27,406 | $44,375 |
| Maximum | $111,362 | $103,973 |
| Range | $83,956 | $59,598 |
| Mean | $71,713 | $72,774 |
| Median | $72,451 | $69,699 |
| Interquartile 25% (IQ1) | $59,369 | $63,837 |
| Interquartile 75% (IQ3) | $86,431 | $81,474 |
| Interquartile Range (IQR) | $27,062 | $17,637 |
| Standard Deviation (Sample) | $18,247 | $14,936 |
| Standard Deviation (Population) | $18,120 | $14,634 |
Similar Demographics by Median Family Income
Demographics Similar to Guatemalans by Median Family Income
In terms of median family income, the demographic groups most similar to Guatemalans are Indonesian ($88,301, a difference of 0.010%), Immigrants from Nicaragua ($88,267, a difference of 0.030%), Potawatomi ($88,265, a difference of 0.030%), Bangladeshi ($88,358, a difference of 0.070%), and Cherokee ($88,209, a difference of 0.10%).
| Demographics | Rating | Rank | Median Family Income |
| Immigrants | Grenada | 0.1 /100 | #278 | Tragic $89,249 |
| Immigrants | Belize | 0.1 /100 | #279 | Tragic $89,197 |
| British West Indians | 0.1 /100 | #280 | Tragic $88,987 |
| Blackfeet | 0.1 /100 | #281 | Tragic $88,717 |
| Comanche | 0.1 /100 | #282 | Tragic $88,556 |
| Bangladeshis | 0.1 /100 | #283 | Tragic $88,358 |
| Indonesians | 0.1 /100 | #284 | Tragic $88,301 |
| Guatemalans | 0.1 /100 | #285 | Tragic $88,295 |
| Immigrants | Nicaragua | 0.1 /100 | #286 | Tragic $88,267 |
| Potawatomi | 0.1 /100 | #287 | Tragic $88,265 |
| Cherokee | 0.1 /100 | #288 | Tragic $88,209 |
| Central American Indians | 0.1 /100 | #289 | Tragic $88,034 |
| Shoshone | 0.1 /100 | #290 | Tragic $87,872 |
| Immigrants | Cabo Verde | 0.1 /100 | #291 | Tragic $87,830 |
| Africans | 0.1 /100 | #292 | Tragic $87,820 |
Demographics Similar to Yakama by Median Family Income
In terms of median family income, the demographic groups most similar to Yakama are Immigrants from Haiti ($84,018, a difference of 0.10%), Immigrants from Mexico ($83,639, a difference of 0.35%), Immigrants from Honduras ($83,618, a difference of 0.38%), Apache ($84,451, a difference of 0.62%), and Seminole ($83,354, a difference of 0.69%).
| Demographics | Rating | Rank | Median Family Income |
| Immigrants | Central America | 0.0 /100 | #310 | Tragic $85,050 |
| Hondurans | 0.0 /100 | #311 | Tragic $85,004 |
| Cubans | 0.0 /100 | #312 | Tragic $84,981 |
| Choctaw | 0.0 /100 | #313 | Tragic $84,835 |
| Immigrants | Bahamas | 0.0 /100 | #314 | Tragic $84,732 |
| Apache | 0.0 /100 | #315 | Tragic $84,451 |
| Immigrants | Haiti | 0.0 /100 | #316 | Tragic $84,018 |
| Yakama | 0.0 /100 | #317 | Tragic $83,932 |
| Immigrants | Mexico | 0.0 /100 | #318 | Tragic $83,639 |
| Immigrants | Honduras | 0.0 /100 | #319 | Tragic $83,618 |
| Seminole | 0.0 /100 | #320 | Tragic $83,354 |
| Immigrants | Caribbean | 0.0 /100 | #321 | Tragic $83,319 |
| Dominicans | 0.0 /100 | #322 | Tragic $82,888 |
| Bahamians | 0.0 /100 | #323 | Tragic $82,631 |
| Creek | 0.0 /100 | #324 | Tragic $82,560 |