Guamanian/Chamorro vs Serbian Median Female Earnings
COMPARE
Guamanian/Chamorro
Serbian
Median Female Earnings
Median Female Earnings Comparison
Guamanians/Chamorros
Serbians
$38,717
MEDIAN FEMALE EARNINGS
11.5/ 100
METRIC RATING
212th/ 347
METRIC RANK
$40,539
MEDIAN FEMALE EARNINGS
85.2/ 100
METRIC RATING
140th/ 347
METRIC RANK
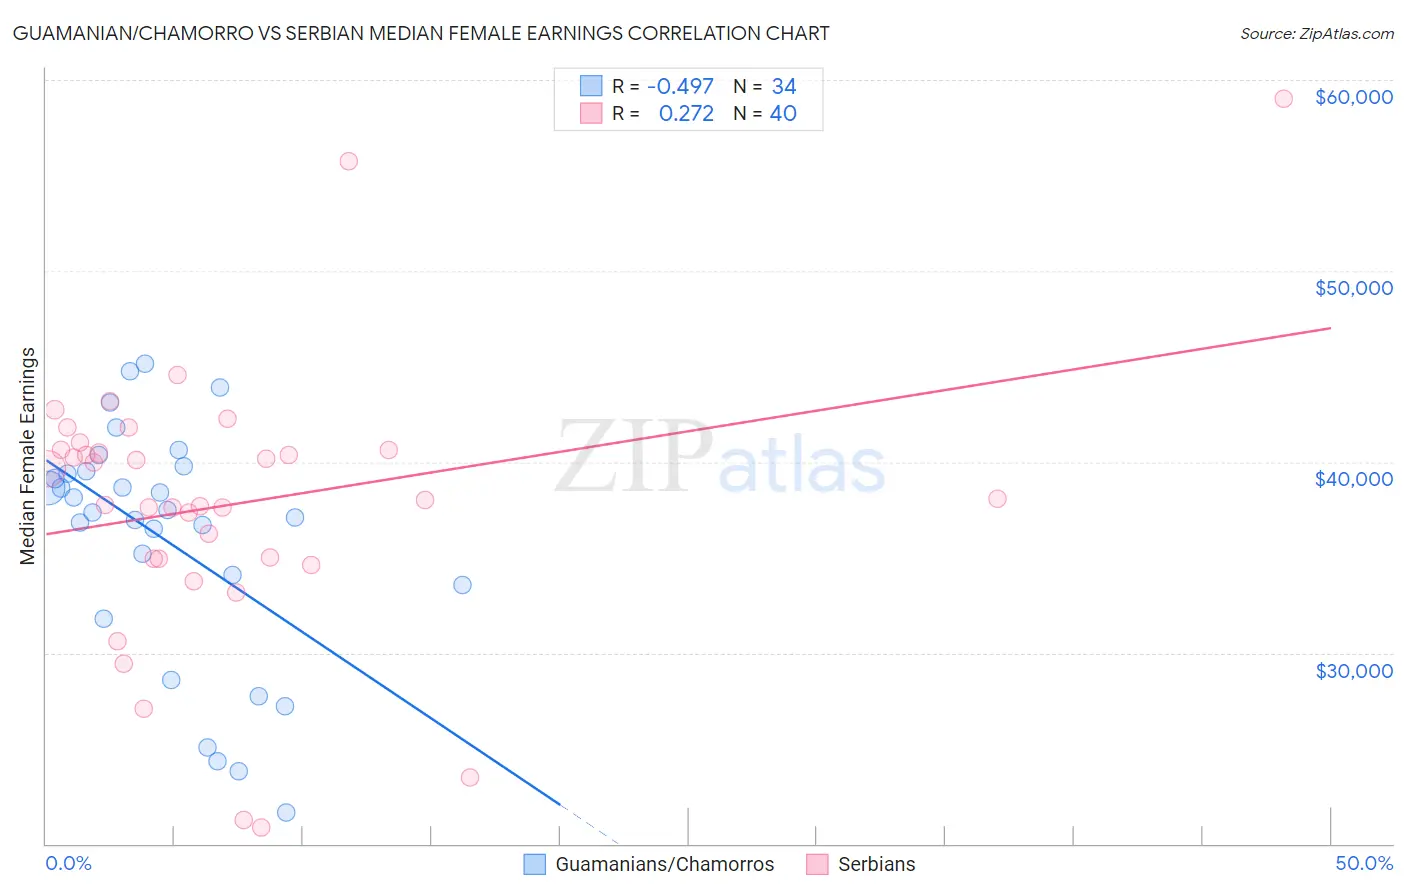
Guamanian/Chamorro vs Serbian Median Female Earnings Correlation Chart
The statistical analysis conducted on geographies consisting of 221,909,570 people shows a moderate negative correlation between the proportion of Guamanians/Chamorros and median female earnings in the United States with a correlation coefficient (R) of -0.497 and weighted average of $38,717. Similarly, the statistical analysis conducted on geographies consisting of 267,582,893 people shows a weak positive correlation between the proportion of Serbians and median female earnings in the United States with a correlation coefficient (R) of 0.272 and weighted average of $40,539, a difference of 4.7%.
Median Female Earnings Correlation Summary
| Measurement | Guamanian/Chamorro | Serbian |
| Minimum | $21,607 | $20,870 |
| Maximum | $45,111 | $59,044 |
| Range | $23,504 | $38,174 |
| Mean | $35,932 | $37,788 |
| Median | $37,420 | $38,020 |
| Interquartile 25% (IQ1) | $33,542 | $34,950 |
| Interquartile 75% (IQ3) | $39,523 | $40,620 |
| Interquartile Range (IQR) | $5,981 | $5,670 |
| Standard Deviation (Sample) | $6,215 | $7,286 |
| Standard Deviation (Population) | $6,122 | $7,194 |
Similar Demographics by Median Female Earnings
Demographics Similar to Guamanians/Chamorros by Median Female Earnings
In terms of median female earnings, the demographic groups most similar to Guamanians/Chamorros are Aleut ($38,719, a difference of 0.010%), Czechoslovakian ($38,738, a difference of 0.050%), Jamaican ($38,670, a difference of 0.12%), Iraqi ($38,666, a difference of 0.13%), and Spaniard ($38,656, a difference of 0.16%).
| Demographics | Rating | Rank | Median Female Earnings |
| Immigrants | Colombia | 16.3 /100 | #205 | Poor $38,913 |
| Immigrants | Bosnia and Herzegovina | 15.6 /100 | #206 | Poor $38,886 |
| Immigrants | Cambodia | 14.2 /100 | #207 | Poor $38,833 |
| Immigrants | Thailand | 13.6 /100 | #208 | Poor $38,810 |
| Norwegians | 13.4 /100 | #209 | Poor $38,802 |
| Czechoslovakians | 12.0 /100 | #210 | Poor $38,738 |
| Aleuts | 11.6 /100 | #211 | Poor $38,719 |
| Guamanians/Chamorros | 11.5 /100 | #212 | Poor $38,717 |
| Jamaicans | 10.5 /100 | #213 | Poor $38,670 |
| Iraqis | 10.5 /100 | #214 | Poor $38,666 |
| Spaniards | 10.3 /100 | #215 | Poor $38,656 |
| Immigrants | Ecuador | 10.1 /100 | #216 | Poor $38,644 |
| Immigrants | Jamaica | 9.7 /100 | #217 | Tragic $38,625 |
| Cape Verdeans | 9.5 /100 | #218 | Tragic $38,614 |
| Nepalese | 9.3 /100 | #219 | Tragic $38,603 |
Demographics Similar to Serbians by Median Female Earnings
In terms of median female earnings, the demographic groups most similar to Serbians are Immigrants from South Eastern Asia ($40,558, a difference of 0.050%), Taiwanese ($40,576, a difference of 0.090%), Immigrants from Syria ($40,499, a difference of 0.10%), Sri Lankan ($40,496, a difference of 0.10%), and Northern European ($40,491, a difference of 0.12%).
| Demographics | Rating | Rank | Median Female Earnings |
| Syrians | 89.5 /100 | #133 | Excellent $40,727 |
| Arabs | 89.3 /100 | #134 | Excellent $40,718 |
| Immigrants | Nepal | 89.0 /100 | #135 | Excellent $40,704 |
| Immigrants | Eastern Africa | 87.7 /100 | #136 | Excellent $40,644 |
| Pakistanis | 86.6 /100 | #137 | Excellent $40,596 |
| Taiwanese | 86.1 /100 | #138 | Excellent $40,576 |
| Immigrants | South Eastern Asia | 85.7 /100 | #139 | Excellent $40,558 |
| Serbians | 85.2 /100 | #140 | Excellent $40,539 |
| Immigrants | Syria | 84.1 /100 | #141 | Excellent $40,499 |
| Sri Lankans | 84.0 /100 | #142 | Excellent $40,496 |
| Northern Europeans | 83.9 /100 | #143 | Excellent $40,491 |
| Immigrants | North Macedonia | 83.8 /100 | #144 | Excellent $40,488 |
| Brazilians | 83.6 /100 | #145 | Excellent $40,483 |
| Ghanaians | 82.1 /100 | #146 | Excellent $40,429 |
| Vietnamese | 80.4 /100 | #147 | Excellent $40,377 |