Guamanian/Chamorro vs Serbian Master's Degree
COMPARE
Guamanian/Chamorro
Serbian
Master's Degree
Master's Degree Comparison
Guamanians/Chamorros
Serbians
13.1%
MASTER'S DEGREE
2.2/ 100
METRIC RATING
240th/ 347
METRIC RANK
16.1%
MASTER'S DEGREE
91.7/ 100
METRIC RATING
132nd/ 347
METRIC RANK
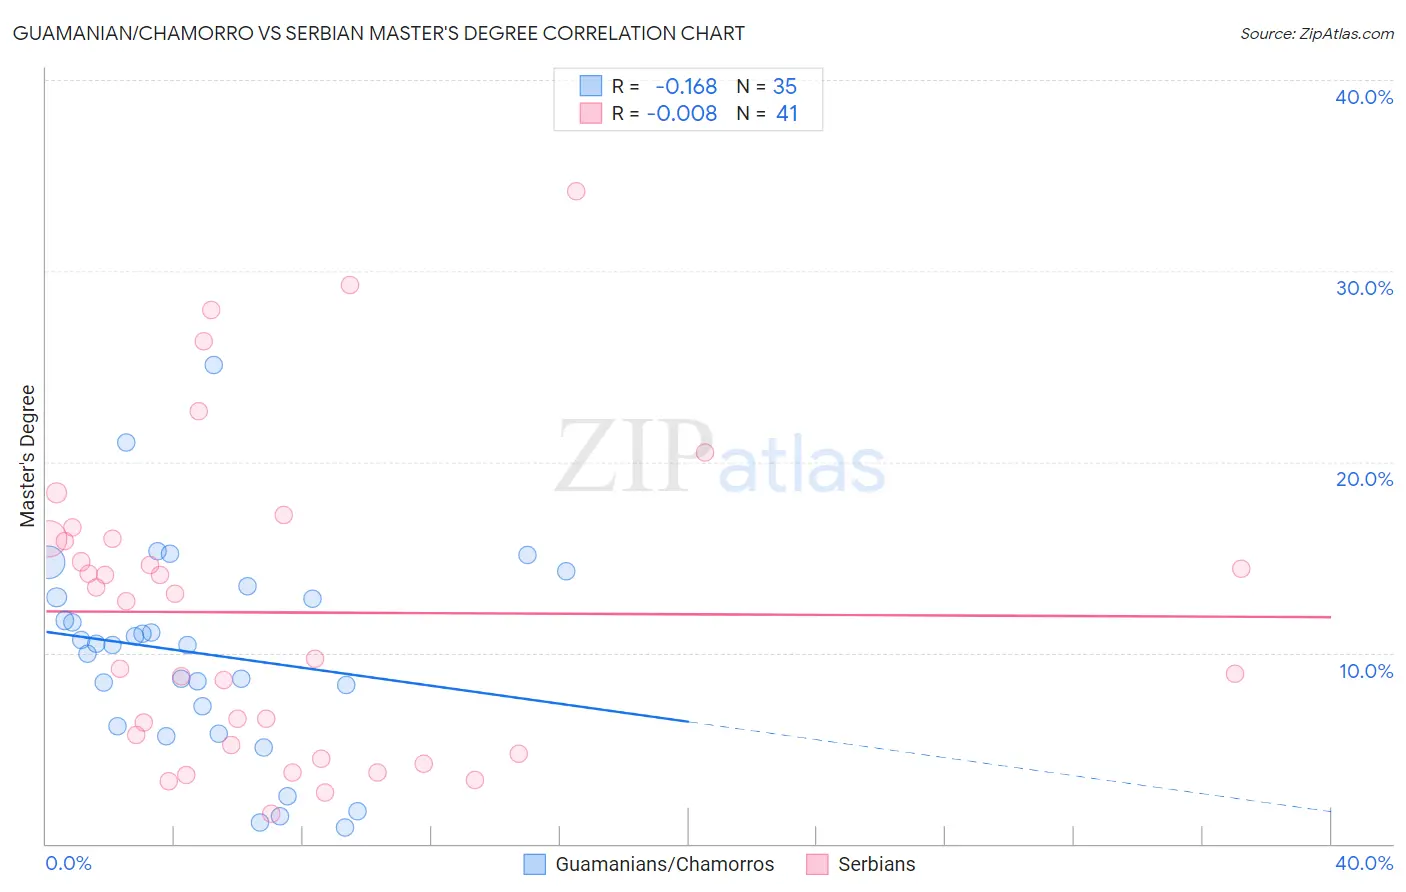
Guamanian/Chamorro vs Serbian Master's Degree Correlation Chart
The statistical analysis conducted on geographies consisting of 221,931,951 people shows a poor negative correlation between the proportion of Guamanians/Chamorros and percentage of population with at least master's degree education in the United States with a correlation coefficient (R) of -0.168 and weighted average of 13.1%. Similarly, the statistical analysis conducted on geographies consisting of 267,595,845 people shows no correlation between the proportion of Serbians and percentage of population with at least master's degree education in the United States with a correlation coefficient (R) of -0.008 and weighted average of 16.1%, a difference of 22.7%.
Master's Degree Correlation Summary
| Measurement | Guamanian/Chamorro | Serbian |
| Minimum | 0.85% | 1.5% |
| Maximum | 25.0% | 34.2% |
| Range | 24.2% | 32.6% |
| Mean | 9.9% | 12.1% |
| Median | 10.4% | 12.7% |
| Interquartile 25% (IQ1) | 6.1% | 5.0% |
| Interquartile 75% (IQ3) | 12.9% | 16.0% |
| Interquartile Range (IQR) | 6.7% | 11.0% |
| Standard Deviation (Sample) | 5.3% | 8.0% |
| Standard Deviation (Population) | 5.2% | 7.9% |
Similar Demographics by Master's Degree
Demographics Similar to Guamanians/Chamorros by Master's Degree
In terms of master's degree, the demographic groups most similar to Guamanians/Chamorros are U.S. Virgin Islander (13.1%, a difference of 0.14%), Spanish American (13.0%, a difference of 0.43%), Immigrants from Jamaica (13.0%, a difference of 0.47%), Delaware (13.0%, a difference of 0.85%), and Immigrants from Bahamas (12.9%, a difference of 1.5%).
| Demographics | Rating | Rank | Master's Degree |
| Immigrants | Ecuador | 5.7 /100 | #233 | Tragic 13.6% |
| Immigrants | Burma/Myanmar | 5.0 /100 | #234 | Tragic 13.5% |
| German Russians | 4.5 /100 | #235 | Tragic 13.5% |
| Immigrants | Guyana | 4.4 /100 | #236 | Tragic 13.4% |
| Jamaicans | 4.1 /100 | #237 | Tragic 13.4% |
| Hmong | 4.0 /100 | #238 | Tragic 13.4% |
| Immigrants | Nonimmigrants | 3.4 /100 | #239 | Tragic 13.3% |
| Guamanians/Chamorros | 2.2 /100 | #240 | Tragic 13.1% |
| U.S. Virgin Islanders | 2.1 /100 | #241 | Tragic 13.1% |
| Spanish Americans | 1.9 /100 | #242 | Tragic 13.0% |
| Immigrants | Jamaica | 1.9 /100 | #243 | Tragic 13.0% |
| Delaware | 1.7 /100 | #244 | Tragic 13.0% |
| Immigrants | Bahamas | 1.4 /100 | #245 | Tragic 12.9% |
| Immigrants | Cambodia | 1.4 /100 | #246 | Tragic 12.9% |
| Iroquois | 1.4 /100 | #247 | Tragic 12.9% |
Demographics Similar to Serbians by Master's Degree
In terms of master's degree, the demographic groups most similar to Serbians are Taiwanese (16.1%, a difference of 0.090%), Immigrants from Jordan (16.1%, a difference of 0.41%), Immigrants from Sudan (16.0%, a difference of 0.54%), Immigrants from Syria (16.2%, a difference of 0.67%), and Venezuelan (15.9%, a difference of 1.1%).
| Demographics | Rating | Rank | Master's Degree |
| Italians | 95.4 /100 | #125 | Exceptional 16.4% |
| Immigrants | Eastern Africa | 95.2 /100 | #126 | Exceptional 16.3% |
| Palestinians | 94.8 /100 | #127 | Exceptional 16.3% |
| Immigrants | Sierra Leone | 94.7 /100 | #128 | Exceptional 16.3% |
| Immigrants | Syria | 93.3 /100 | #129 | Exceptional 16.2% |
| Immigrants | Jordan | 92.7 /100 | #130 | Exceptional 16.1% |
| Taiwanese | 91.9 /100 | #131 | Exceptional 16.1% |
| Serbians | 91.7 /100 | #132 | Exceptional 16.1% |
| Immigrants | Sudan | 90.2 /100 | #133 | Exceptional 16.0% |
| Venezuelans | 88.4 /100 | #134 | Excellent 15.9% |
| South American Indians | 88.4 /100 | #135 | Excellent 15.9% |
| Assyrians/Chaldeans/Syriacs | 86.8 /100 | #136 | Excellent 15.8% |
| Europeans | 86.4 /100 | #137 | Excellent 15.8% |
| Pakistanis | 86.1 /100 | #138 | Excellent 15.8% |
| Immigrants | Germany | 85.9 /100 | #139 | Excellent 15.8% |