Guamanian/Chamorro vs Austrian Median Female Earnings
COMPARE
Guamanian/Chamorro
Austrian
Median Female Earnings
Median Female Earnings Comparison
Guamanians/Chamorros
Austrians
$38,717
MEDIAN FEMALE EARNINGS
11.5/ 100
METRIC RATING
212th/ 347
METRIC RANK
$40,923
MEDIAN FEMALE EARNINGS
92.7/ 100
METRIC RATING
125th/ 347
METRIC RANK
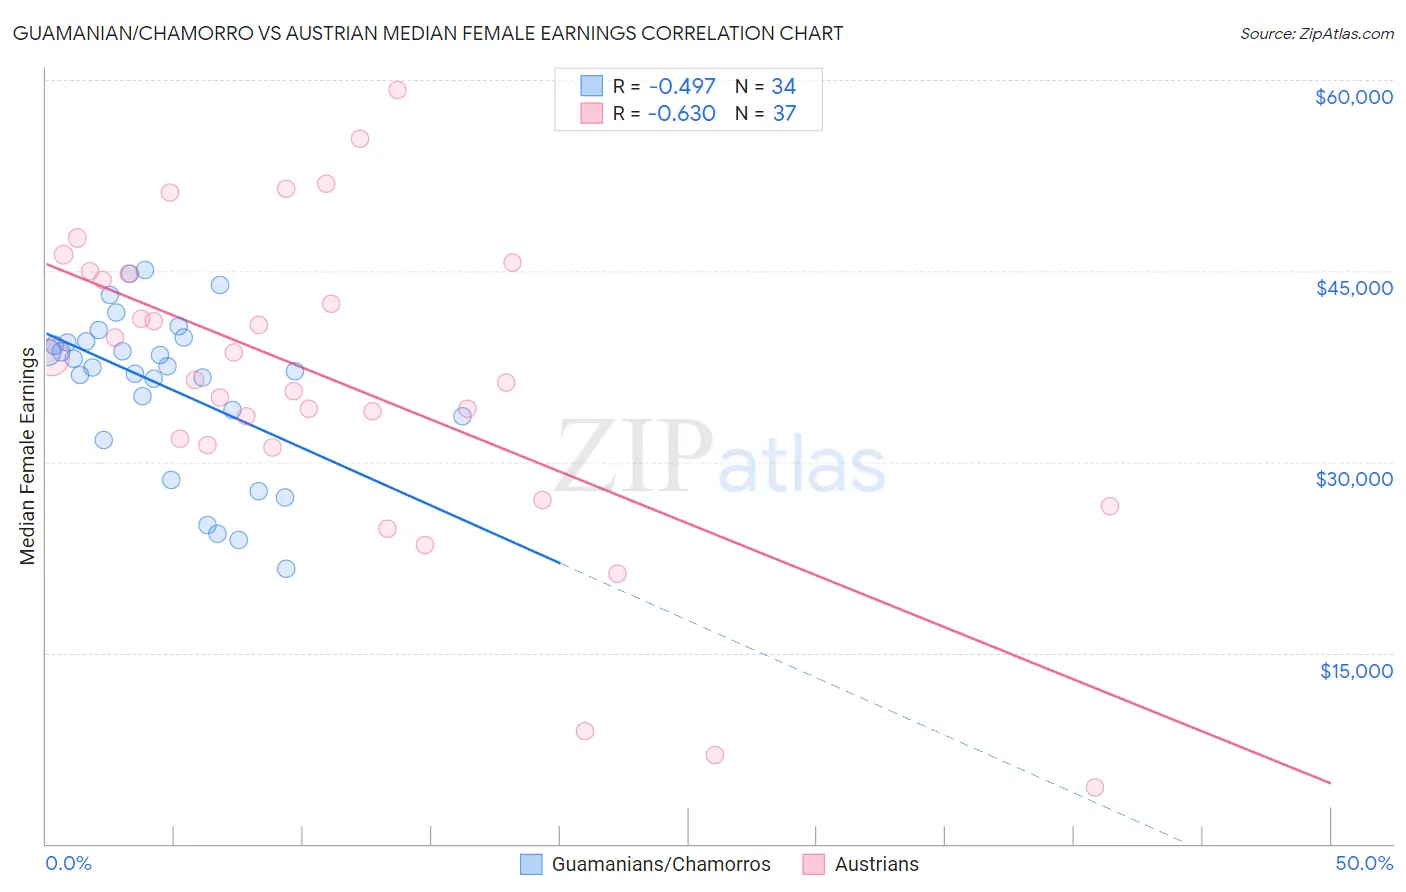
Guamanian/Chamorro vs Austrian Median Female Earnings Correlation Chart
The statistical analysis conducted on geographies consisting of 221,909,570 people shows a moderate negative correlation between the proportion of Guamanians/Chamorros and median female earnings in the United States with a correlation coefficient (R) of -0.497 and weighted average of $38,717. Similarly, the statistical analysis conducted on geographies consisting of 451,723,547 people shows a significant negative correlation between the proportion of Austrians and median female earnings in the United States with a correlation coefficient (R) of -0.630 and weighted average of $40,923, a difference of 5.7%.
Median Female Earnings Correlation Summary
| Measurement | Guamanian/Chamorro | Austrian |
| Minimum | $21,607 | $4,400 |
| Maximum | $45,111 | $59,167 |
| Range | $23,504 | $54,767 |
| Mean | $35,932 | $36,245 |
| Median | $37,420 | $36,406 |
| Interquartile 25% (IQ1) | $33,542 | $31,217 |
| Interquartile 75% (IQ3) | $39,523 | $44,864 |
| Interquartile Range (IQR) | $5,981 | $13,647 |
| Standard Deviation (Sample) | $6,215 | $12,547 |
| Standard Deviation (Population) | $6,122 | $12,376 |
Similar Demographics by Median Female Earnings
Demographics Similar to Guamanians/Chamorros by Median Female Earnings
In terms of median female earnings, the demographic groups most similar to Guamanians/Chamorros are Aleut ($38,719, a difference of 0.010%), Czechoslovakian ($38,738, a difference of 0.050%), Jamaican ($38,670, a difference of 0.12%), Iraqi ($38,666, a difference of 0.13%), and Spaniard ($38,656, a difference of 0.16%).
| Demographics | Rating | Rank | Median Female Earnings |
| Immigrants | Colombia | 16.3 /100 | #205 | Poor $38,913 |
| Immigrants | Bosnia and Herzegovina | 15.6 /100 | #206 | Poor $38,886 |
| Immigrants | Cambodia | 14.2 /100 | #207 | Poor $38,833 |
| Immigrants | Thailand | 13.6 /100 | #208 | Poor $38,810 |
| Norwegians | 13.4 /100 | #209 | Poor $38,802 |
| Czechoslovakians | 12.0 /100 | #210 | Poor $38,738 |
| Aleuts | 11.6 /100 | #211 | Poor $38,719 |
| Guamanians/Chamorros | 11.5 /100 | #212 | Poor $38,717 |
| Jamaicans | 10.5 /100 | #213 | Poor $38,670 |
| Iraqis | 10.5 /100 | #214 | Poor $38,666 |
| Spaniards | 10.3 /100 | #215 | Poor $38,656 |
| Immigrants | Ecuador | 10.1 /100 | #216 | Poor $38,644 |
| Immigrants | Jamaica | 9.7 /100 | #217 | Tragic $38,625 |
| Cape Verdeans | 9.5 /100 | #218 | Tragic $38,614 |
| Nepalese | 9.3 /100 | #219 | Tragic $38,603 |
Demographics Similar to Austrians by Median Female Earnings
In terms of median female earnings, the demographic groups most similar to Austrians are Immigrants from Trinidad and Tobago ($40,895, a difference of 0.070%), Ugandan ($40,889, a difference of 0.080%), Trinidadian and Tobagonian ($40,958, a difference of 0.090%), Guyanese ($40,973, a difference of 0.12%), and Immigrants from Jordan ($40,977, a difference of 0.13%).
| Demographics | Rating | Rank | Median Female Earnings |
| Immigrants | Lebanon | 95.6 /100 | #118 | Exceptional $41,183 |
| Immigrants | Philippines | 95.0 /100 | #119 | Exceptional $41,114 |
| Immigrants | Kuwait | 94.4 /100 | #120 | Exceptional $41,055 |
| Croatians | 93.7 /100 | #121 | Exceptional $40,993 |
| Immigrants | Jordan | 93.5 /100 | #122 | Exceptional $40,977 |
| Guyanese | 93.4 /100 | #123 | Exceptional $40,973 |
| Trinidadians and Tobagonians | 93.2 /100 | #124 | Exceptional $40,958 |
| Austrians | 92.7 /100 | #125 | Exceptional $40,923 |
| Immigrants | Trinidad and Tobago | 92.3 /100 | #126 | Exceptional $40,895 |
| Ugandans | 92.2 /100 | #127 | Exceptional $40,889 |
| Carpatho Rusyns | 91.2 /100 | #128 | Exceptional $40,825 |
| Zimbabweans | 90.8 /100 | #129 | Exceptional $40,798 |
| Immigrants | Guyana | 90.3 /100 | #130 | Exceptional $40,773 |
| Chileans | 90.0 /100 | #131 | Exceptional $40,757 |
| Immigrants | Uganda | 89.7 /100 | #132 | Excellent $40,739 |