Guamanian/Chamorro vs Immigrants from Congo Median Female Earnings
COMPARE
Guamanian/Chamorro
Immigrants from Congo
Median Female Earnings
Median Female Earnings Comparison
Guamanians/Chamorros
Immigrants from Congo
$38,717
MEDIAN FEMALE EARNINGS
11.5/ 100
METRIC RATING
212th/ 347
METRIC RANK
$34,317
MEDIAN FEMALE EARNINGS
0.0/ 100
METRIC RATING
324th/ 347
METRIC RANK
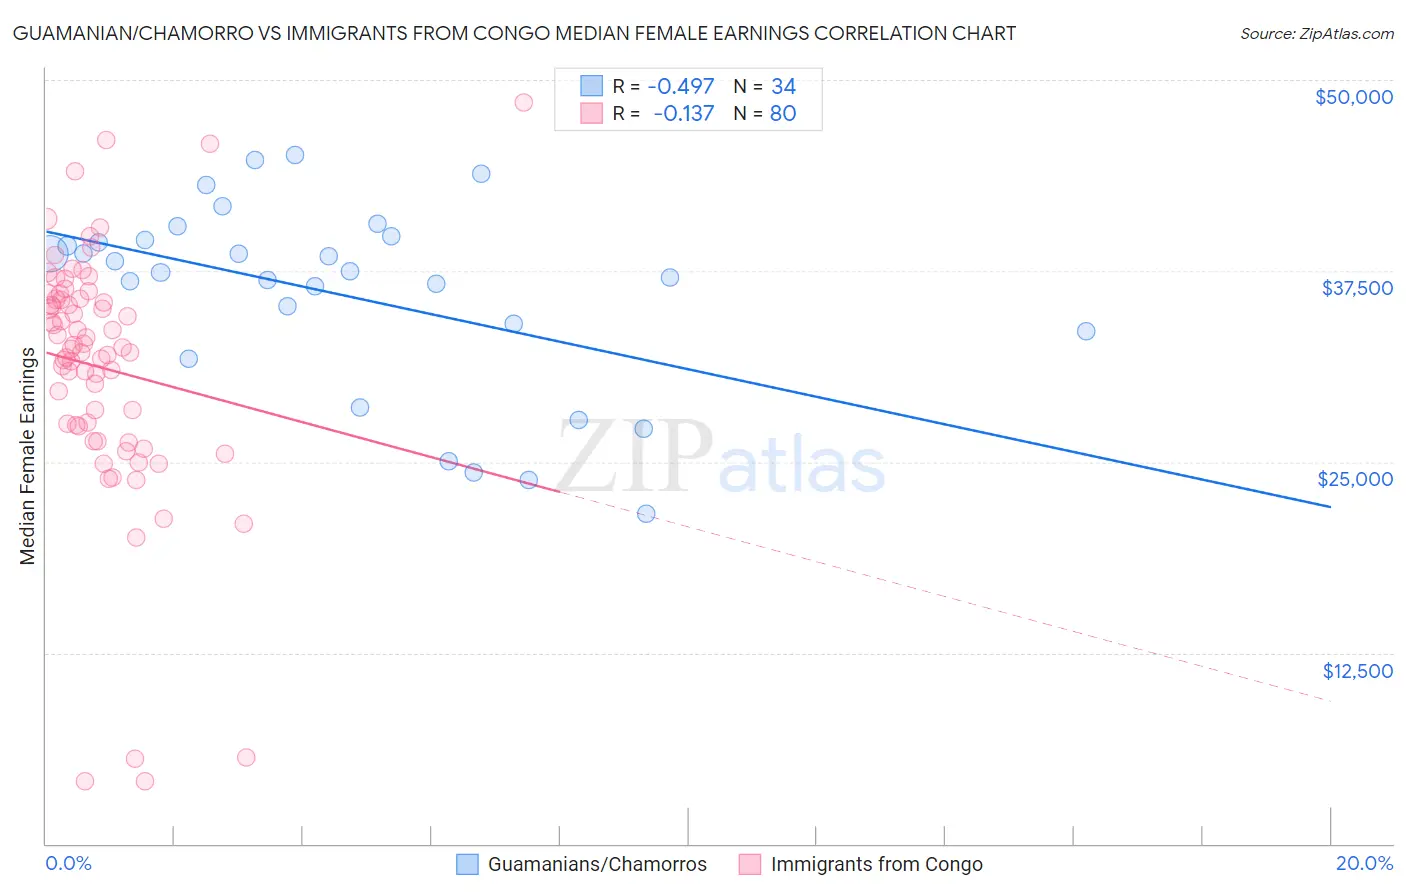
Guamanian/Chamorro vs Immigrants from Congo Median Female Earnings Correlation Chart
The statistical analysis conducted on geographies consisting of 221,909,570 people shows a moderate negative correlation between the proportion of Guamanians/Chamorros and median female earnings in the United States with a correlation coefficient (R) of -0.497 and weighted average of $38,717. Similarly, the statistical analysis conducted on geographies consisting of 92,121,393 people shows a poor negative correlation between the proportion of Immigrants from Congo and median female earnings in the United States with a correlation coefficient (R) of -0.137 and weighted average of $34,317, a difference of 12.8%.
Median Female Earnings Correlation Summary
| Measurement | Guamanian/Chamorro | Immigrants from Congo |
| Minimum | $21,607 | $4,095 |
| Maximum | $45,111 | $48,487 |
| Range | $23,504 | $44,392 |
| Mean | $35,932 | $31,171 |
| Median | $37,420 | $32,459 |
| Interquartile 25% (IQ1) | $33,542 | $27,374 |
| Interquartile 75% (IQ3) | $39,523 | $35,656 |
| Interquartile Range (IQR) | $5,981 | $8,283 |
| Standard Deviation (Sample) | $6,215 | $8,300 |
| Standard Deviation (Population) | $6,122 | $8,248 |
Similar Demographics by Median Female Earnings
Demographics Similar to Guamanians/Chamorros by Median Female Earnings
In terms of median female earnings, the demographic groups most similar to Guamanians/Chamorros are Aleut ($38,719, a difference of 0.010%), Czechoslovakian ($38,738, a difference of 0.050%), Jamaican ($38,670, a difference of 0.12%), Iraqi ($38,666, a difference of 0.13%), and Spaniard ($38,656, a difference of 0.16%).
| Demographics | Rating | Rank | Median Female Earnings |
| Immigrants | Colombia | 16.3 /100 | #205 | Poor $38,913 |
| Immigrants | Bosnia and Herzegovina | 15.6 /100 | #206 | Poor $38,886 |
| Immigrants | Cambodia | 14.2 /100 | #207 | Poor $38,833 |
| Immigrants | Thailand | 13.6 /100 | #208 | Poor $38,810 |
| Norwegians | 13.4 /100 | #209 | Poor $38,802 |
| Czechoslovakians | 12.0 /100 | #210 | Poor $38,738 |
| Aleuts | 11.6 /100 | #211 | Poor $38,719 |
| Guamanians/Chamorros | 11.5 /100 | #212 | Poor $38,717 |
| Jamaicans | 10.5 /100 | #213 | Poor $38,670 |
| Iraqis | 10.5 /100 | #214 | Poor $38,666 |
| Spaniards | 10.3 /100 | #215 | Poor $38,656 |
| Immigrants | Ecuador | 10.1 /100 | #216 | Poor $38,644 |
| Immigrants | Jamaica | 9.7 /100 | #217 | Tragic $38,625 |
| Cape Verdeans | 9.5 /100 | #218 | Tragic $38,614 |
| Nepalese | 9.3 /100 | #219 | Tragic $38,603 |
Demographics Similar to Immigrants from Congo by Median Female Earnings
In terms of median female earnings, the demographic groups most similar to Immigrants from Congo are Seminole ($34,385, a difference of 0.20%), Chickasaw ($34,414, a difference of 0.28%), Hispanic or Latino ($34,421, a difference of 0.31%), Dutch West Indian ($34,106, a difference of 0.62%), and Kiowa ($34,074, a difference of 0.71%).
| Demographics | Rating | Rank | Median Female Earnings |
| Potawatomi | 0.0 /100 | #317 | Tragic $34,739 |
| Immigrants | Yemen | 0.0 /100 | #318 | Tragic $34,693 |
| Shoshone | 0.0 /100 | #319 | Tragic $34,677 |
| Immigrants | Honduras | 0.0 /100 | #320 | Tragic $34,647 |
| Hispanics or Latinos | 0.0 /100 | #321 | Tragic $34,421 |
| Chickasaw | 0.0 /100 | #322 | Tragic $34,414 |
| Seminole | 0.0 /100 | #323 | Tragic $34,385 |
| Immigrants | Congo | 0.0 /100 | #324 | Tragic $34,317 |
| Dutch West Indians | 0.0 /100 | #325 | Tragic $34,106 |
| Kiowa | 0.0 /100 | #326 | Tragic $34,074 |
| Cajuns | 0.0 /100 | #327 | Tragic $34,034 |
| Immigrants | Central America | 0.0 /100 | #328 | Tragic $33,953 |
| Hopi | 0.0 /100 | #329 | Tragic $33,932 |
| Menominee | 0.0 /100 | #330 | Tragic $33,894 |
| Natives/Alaskans | 0.0 /100 | #331 | Tragic $33,806 |