Greek vs Immigrants from Russia Median Family Income
COMPARE
Greek
Immigrants from Russia
Median Family Income
Median Family Income Comparison
Greeks
Immigrants from Russia
$115,192
MEDIAN FAMILY INCOME
99.8/ 100
METRIC RATING
57th/ 347
METRIC RANK
$116,942
MEDIAN FAMILY INCOME
99.9/ 100
METRIC RATING
46th/ 347
METRIC RANK
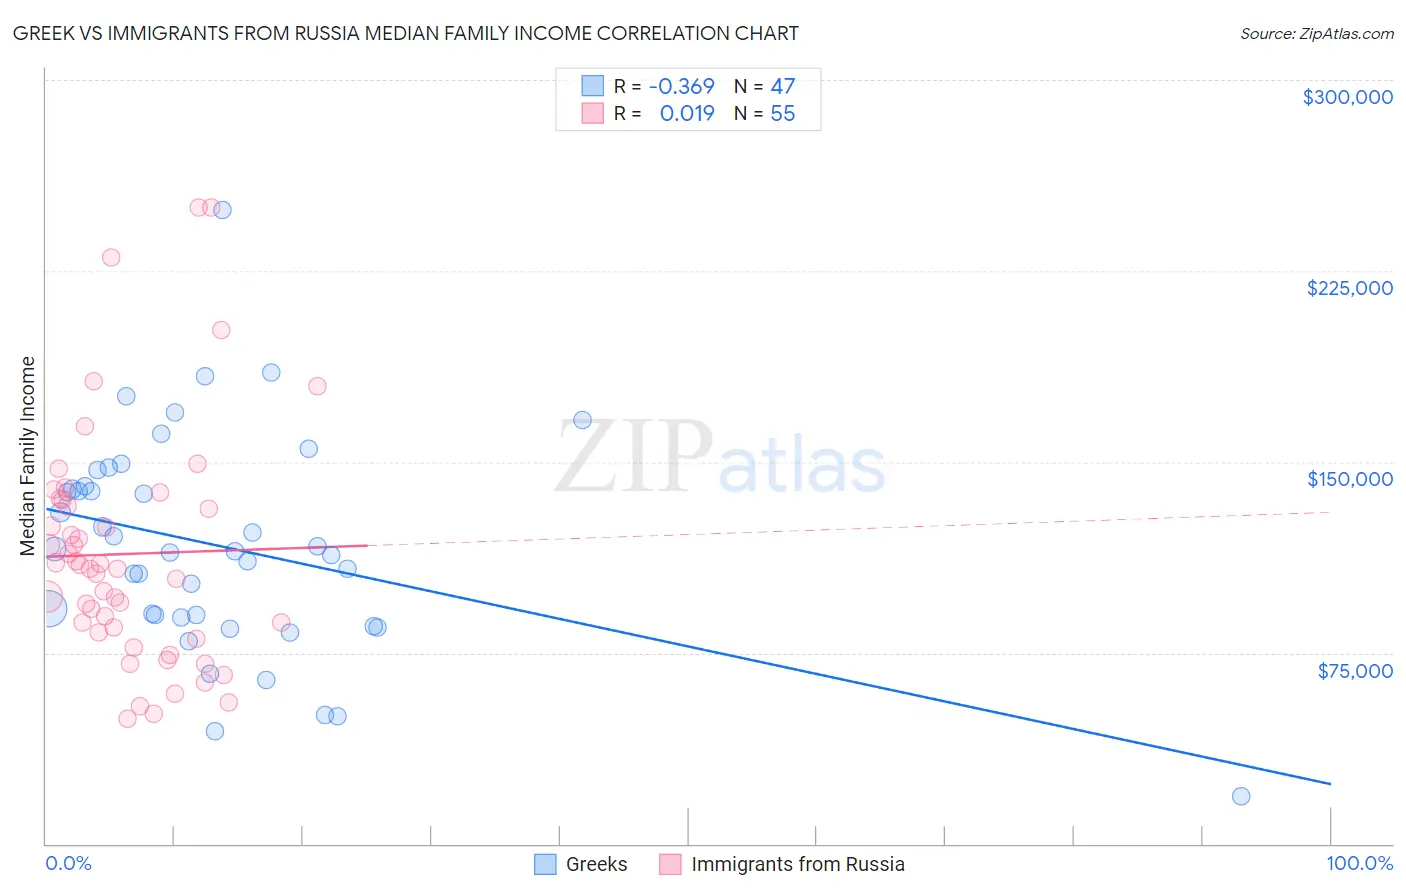
Greek vs Immigrants from Russia Median Family Income Correlation Chart
The statistical analysis conducted on geographies consisting of 482,131,670 people shows a mild negative correlation between the proportion of Greeks and median family income in the United States with a correlation coefficient (R) of -0.369 and weighted average of $115,192. Similarly, the statistical analysis conducted on geographies consisting of 347,641,134 people shows no correlation between the proportion of Immigrants from Russia and median family income in the United States with a correlation coefficient (R) of 0.019 and weighted average of $116,942, a difference of 1.5%.
Median Family Income Correlation Summary
| Measurement | Greek | Immigrants from Russia |
| Minimum | $18,825 | $49,167 |
| Maximum | $248,750 | $250,001 |
| Range | $229,925 | $200,834 |
| Mean | $116,811 | $113,842 |
| Median | $115,024 | $107,999 |
| Interquartile 25% (IQ1) | $88,890 | $83,101 |
| Interquartile 75% (IQ3) | $140,272 | $134,951 |
| Interquartile Range (IQR) | $51,382 | $51,850 |
| Standard Deviation (Sample) | $42,578 | $46,059 |
| Standard Deviation (Population) | $42,122 | $45,638 |
Demographics Similar to Greeks and Immigrants from Russia by Median Family Income
In terms of median family income, the demographic groups most similar to Greeks are New Zealander ($115,230, a difference of 0.030%), Immigrants from Indonesia ($115,162, a difference of 0.030%), Lithuanian ($115,395, a difference of 0.18%), Immigrants from Netherlands ($114,987, a difference of 0.18%), and Immigrants from Europe ($115,523, a difference of 0.29%). Similarly, the demographic groups most similar to Immigrants from Russia are Immigrants from Austria ($116,830, a difference of 0.10%), Immigrants from Greece ($117,344, a difference of 0.34%), Immigrants from South Africa ($116,286, a difference of 0.56%), Chinese ($116,188, a difference of 0.65%), and Immigrants from Czechoslovakia ($116,165, a difference of 0.67%).
| Demographics | Rating | Rank | Median Family Income |
| Estonians | 100.0 /100 | #41 | Exceptional $118,013 |
| Immigrants | Bolivia | 100.0 /100 | #42 | Exceptional $117,912 |
| Bulgarians | 100.0 /100 | #43 | Exceptional $117,818 |
| Cambodians | 100.0 /100 | #44 | Exceptional $117,780 |
| Immigrants | Greece | 99.9 /100 | #45 | Exceptional $117,344 |
| Immigrants | Russia | 99.9 /100 | #46 | Exceptional $116,942 |
| Immigrants | Austria | 99.9 /100 | #47 | Exceptional $116,830 |
| Immigrants | South Africa | 99.9 /100 | #48 | Exceptional $116,286 |
| Chinese | 99.9 /100 | #49 | Exceptional $116,188 |
| Immigrants | Czechoslovakia | 99.9 /100 | #50 | Exceptional $116,165 |
| Immigrants | Malaysia | 99.9 /100 | #51 | Exceptional $115,880 |
| Maltese | 99.9 /100 | #52 | Exceptional $115,862 |
| Immigrants | Norway | 99.9 /100 | #53 | Exceptional $115,847 |
| Immigrants | Europe | 99.9 /100 | #54 | Exceptional $115,523 |
| Lithuanians | 99.8 /100 | #55 | Exceptional $115,395 |
| New Zealanders | 99.8 /100 | #56 | Exceptional $115,230 |
| Greeks | 99.8 /100 | #57 | Exceptional $115,192 |
| Immigrants | Indonesia | 99.8 /100 | #58 | Exceptional $115,162 |
| Immigrants | Netherlands | 99.8 /100 | #59 | Exceptional $114,987 |
| Immigrants | Latvia | 99.8 /100 | #60 | Exceptional $114,826 |
| Immigrants | Belarus | 99.8 /100 | #61 | Exceptional $114,586 |