Ghanaian vs Immigrants from Dominica Median Male Earnings
COMPARE
Ghanaian
Immigrants from Dominica
Median Male Earnings
Median Male Earnings Comparison
Ghanaians
Immigrants from Dominica
$52,810
MEDIAN MALE EARNINGS
16.1/ 100
METRIC RATING
204th/ 347
METRIC RANK
$47,651
MEDIAN MALE EARNINGS
0.1/ 100
METRIC RATING
292nd/ 347
METRIC RANK
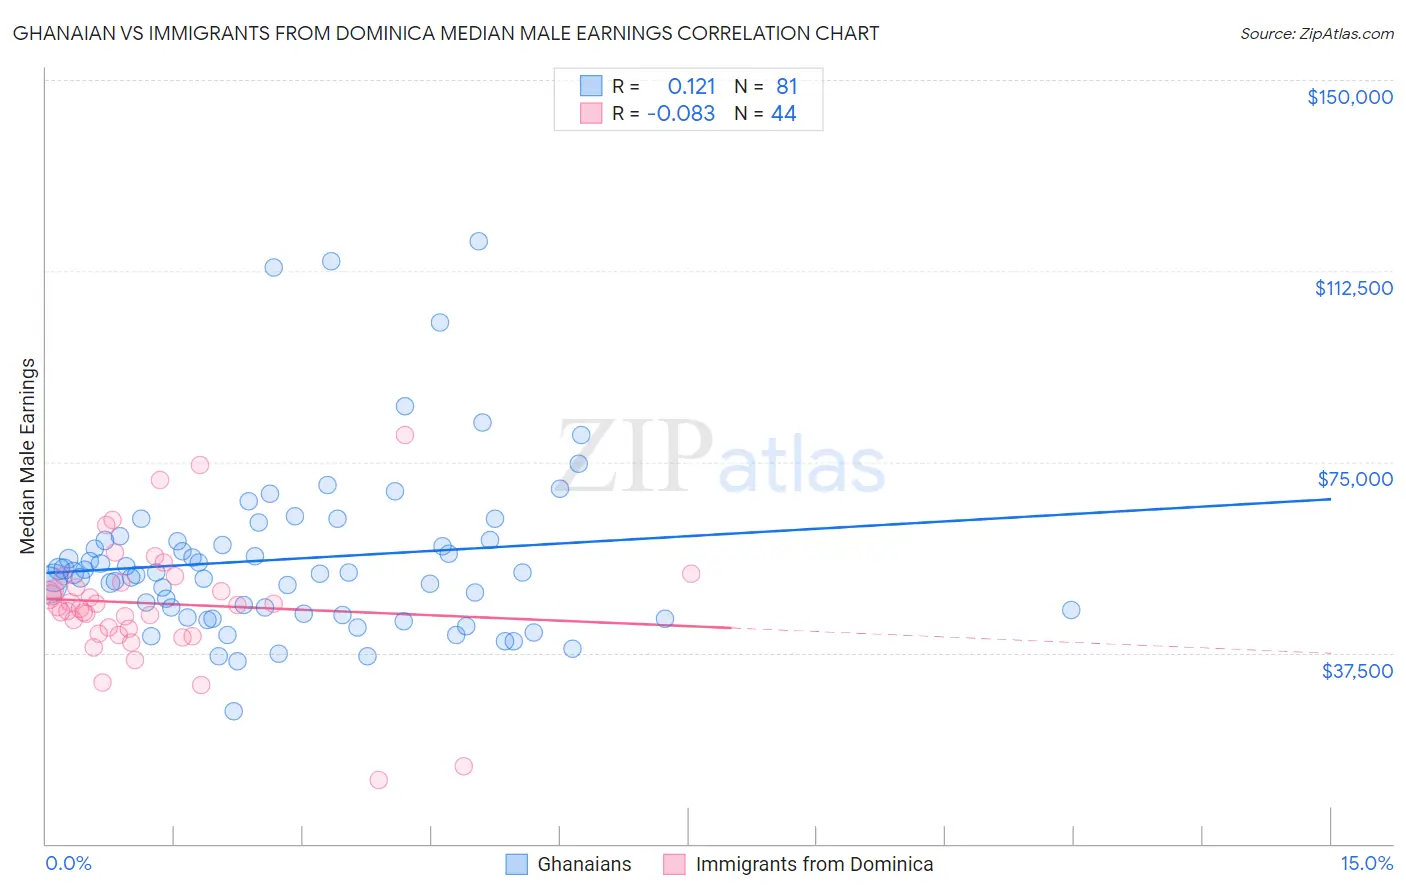
Ghanaian vs Immigrants from Dominica Median Male Earnings Correlation Chart
The statistical analysis conducted on geographies consisting of 190,703,925 people shows a poor positive correlation between the proportion of Ghanaians and median male earnings in the United States with a correlation coefficient (R) of 0.121 and weighted average of $52,810. Similarly, the statistical analysis conducted on geographies consisting of 83,786,748 people shows a slight negative correlation between the proportion of Immigrants from Dominica and median male earnings in the United States with a correlation coefficient (R) of -0.083 and weighted average of $47,651, a difference of 10.8%.
Median Male Earnings Correlation Summary
| Measurement | Ghanaian | Immigrants from Dominica |
| Minimum | $26,089 | $12,476 |
| Maximum | $118,333 | $80,370 |
| Range | $92,244 | $67,894 |
| Mean | $55,935 | $47,178 |
| Median | $53,206 | $46,677 |
| Interquartile 25% (IQ1) | $44,949 | $41,694 |
| Interquartile 75% (IQ3) | $59,627 | $51,930 |
| Interquartile Range (IQR) | $14,678 | $10,236 |
| Standard Deviation (Sample) | $16,875 | $12,354 |
| Standard Deviation (Population) | $16,771 | $12,213 |
Similar Demographics by Median Male Earnings
Demographics Similar to Ghanaians by Median Male Earnings
In terms of median male earnings, the demographic groups most similar to Ghanaians are Panamanian ($52,835, a difference of 0.050%), Immigrants from Uruguay ($52,860, a difference of 0.10%), Immigrants from Bosnia and Herzegovina ($52,869, a difference of 0.11%), Immigrants from Colombia ($52,725, a difference of 0.16%), and Immigrants from Thailand ($52,908, a difference of 0.19%).
| Demographics | Rating | Rank | Median Male Earnings |
| Immigrants | Kenya | 26.0 /100 | #197 | Fair $53,427 |
| Immigrants | Costa Rica | 22.6 /100 | #198 | Fair $53,237 |
| Tongans | 22.3 /100 | #199 | Fair $53,218 |
| Immigrants | Thailand | 17.5 /100 | #200 | Poor $52,908 |
| Immigrants | Bosnia and Herzegovina | 16.9 /100 | #201 | Poor $52,869 |
| Immigrants | Uruguay | 16.8 /100 | #202 | Poor $52,860 |
| Panamanians | 16.5 /100 | #203 | Poor $52,835 |
| Ghanaians | 16.1 /100 | #204 | Poor $52,810 |
| Immigrants | Colombia | 15.0 /100 | #205 | Poor $52,725 |
| Immigrants | Iraq | 14.5 /100 | #206 | Poor $52,681 |
| Vietnamese | 12.7 /100 | #207 | Poor $52,525 |
| Venezuelans | 12.5 /100 | #208 | Poor $52,510 |
| Bermudans | 12.1 /100 | #209 | Poor $52,465 |
| Delaware | 11.5 /100 | #210 | Poor $52,412 |
| Tlingit-Haida | 11.5 /100 | #211 | Poor $52,409 |
Demographics Similar to Immigrants from Dominica by Median Male Earnings
In terms of median male earnings, the demographic groups most similar to Immigrants from Dominica are Choctaw ($47,729, a difference of 0.16%), Indonesian ($47,503, a difference of 0.31%), Immigrants from Belize ($47,809, a difference of 0.33%), Immigrants from Nicaragua ($47,482, a difference of 0.36%), and Chickasaw ($47,832, a difference of 0.38%).
| Demographics | Rating | Rank | Median Male Earnings |
| Paiute | 0.2 /100 | #285 | Tragic $47,991 |
| Mexican American Indians | 0.2 /100 | #286 | Tragic $47,990 |
| Immigrants | El Salvador | 0.2 /100 | #287 | Tragic $47,973 |
| Shoshone | 0.2 /100 | #288 | Tragic $47,930 |
| Chickasaw | 0.1 /100 | #289 | Tragic $47,832 |
| Immigrants | Belize | 0.1 /100 | #290 | Tragic $47,809 |
| Choctaw | 0.1 /100 | #291 | Tragic $47,729 |
| Immigrants | Dominica | 0.1 /100 | #292 | Tragic $47,651 |
| Indonesians | 0.1 /100 | #293 | Tragic $47,503 |
| Immigrants | Nicaragua | 0.1 /100 | #294 | Tragic $47,482 |
| Central American Indians | 0.1 /100 | #295 | Tragic $47,433 |
| Inupiat | 0.1 /100 | #296 | Tragic $47,281 |
| Dominicans | 0.1 /100 | #297 | Tragic $47,204 |
| Immigrants | Micronesia | 0.1 /100 | #298 | Tragic $47,177 |
| Immigrants | Zaire | 0.1 /100 | #299 | Tragic $47,070 |