French American Indian vs Chickasaw Median Earnings
COMPARE
French American Indian
Chickasaw
Median Earnings
Median Earnings Comparison
French American Indians
Chickasaw
$43,333
MEDIAN EARNINGS
1.3/ 100
METRIC RATING
258th/ 347
METRIC RANK
$40,672
MEDIAN EARNINGS
0.0/ 100
METRIC RATING
305th/ 347
METRIC RANK
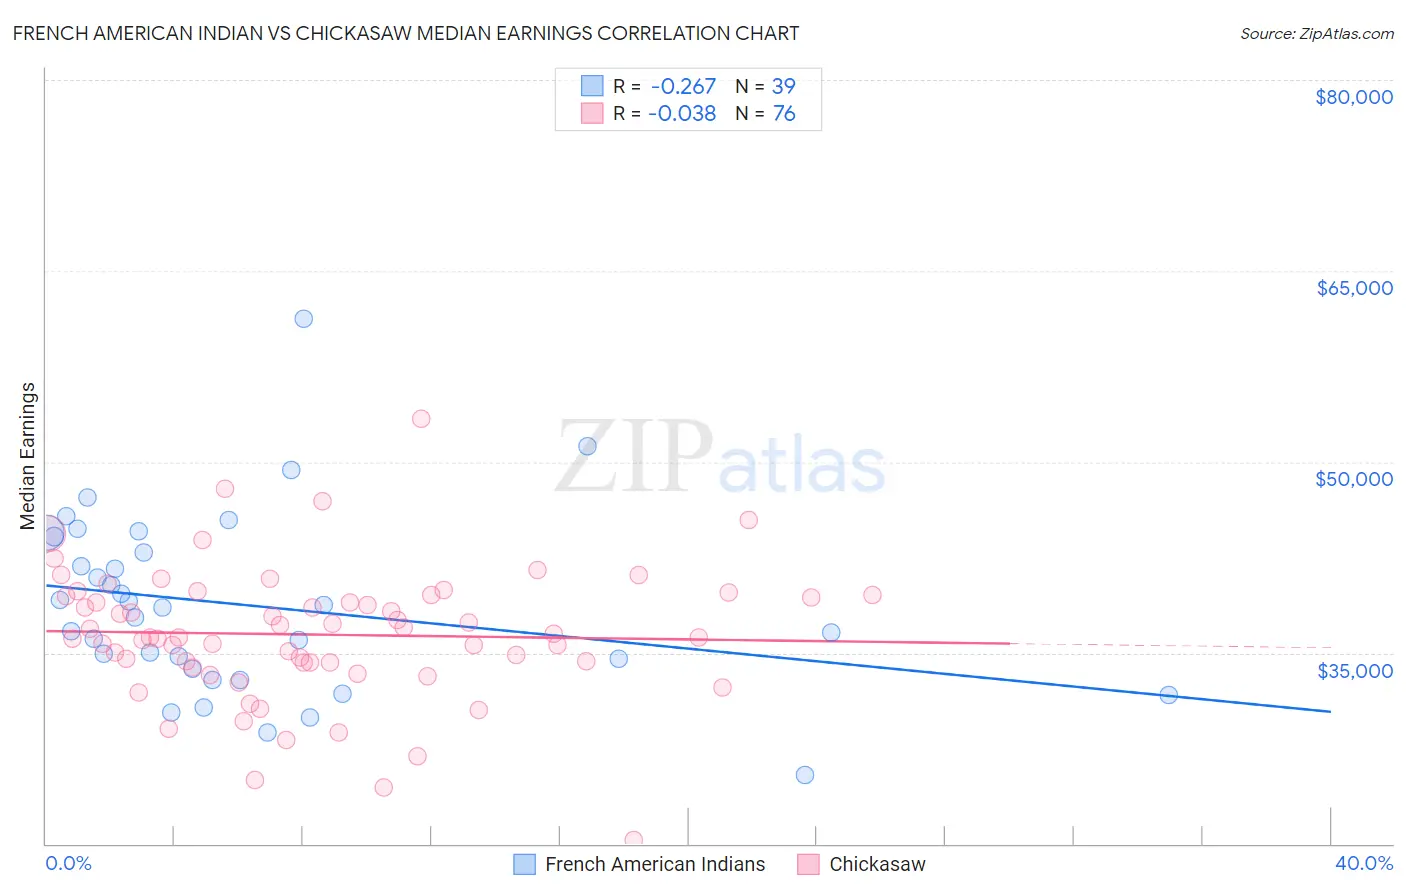
French American Indian vs Chickasaw Median Earnings Correlation Chart
The statistical analysis conducted on geographies consisting of 131,971,536 people shows a weak negative correlation between the proportion of French American Indians and median earnings in the United States with a correlation coefficient (R) of -0.267 and weighted average of $43,333. Similarly, the statistical analysis conducted on geographies consisting of 147,718,191 people shows no correlation between the proportion of Chickasaw and median earnings in the United States with a correlation coefficient (R) of -0.038 and weighted average of $40,672, a difference of 6.5%.
Median Earnings Correlation Summary
| Measurement | French American Indian | Chickasaw |
| Minimum | $25,417 | $20,250 |
| Maximum | $61,250 | $53,432 |
| Range | $35,833 | $33,182 |
| Mean | $38,746 | $36,428 |
| Median | $38,517 | $36,238 |
| Interquartile 25% (IQ1) | $33,745 | $34,220 |
| Interquartile 75% (IQ3) | $44,112 | $39,491 |
| Interquartile Range (IQR) | $10,368 | $5,270 |
| Standard Deviation (Sample) | $7,041 | $5,289 |
| Standard Deviation (Population) | $6,950 | $5,254 |
Similar Demographics by Median Earnings
Demographics Similar to French American Indians by Median Earnings
In terms of median earnings, the demographic groups most similar to French American Indians are Jamaican ($43,343, a difference of 0.020%), Alaskan Athabascan ($43,393, a difference of 0.14%), Immigrants from Middle Africa ($43,416, a difference of 0.19%), German Russian ($43,200, a difference of 0.31%), and Liberian ($43,536, a difference of 0.47%).
| Demographics | Rating | Rank | Median Earnings |
| Tsimshian | 2.1 /100 | #251 | Tragic $43,695 |
| Hawaiians | 2.0 /100 | #252 | Tragic $43,673 |
| Somalis | 1.8 /100 | #253 | Tragic $43,567 |
| Liberians | 1.7 /100 | #254 | Tragic $43,536 |
| Immigrants | Middle Africa | 1.4 /100 | #255 | Tragic $43,416 |
| Alaskan Athabascans | 1.4 /100 | #256 | Tragic $43,393 |
| Jamaicans | 1.3 /100 | #257 | Tragic $43,343 |
| French American Indians | 1.3 /100 | #258 | Tragic $43,333 |
| German Russians | 1.1 /100 | #259 | Tragic $43,200 |
| Immigrants | Somalia | 0.9 /100 | #260 | Tragic $43,100 |
| Immigrants | Jamaica | 0.8 /100 | #261 | Tragic $43,026 |
| Nicaraguans | 0.8 /100 | #262 | Tragic $43,026 |
| Inupiat | 0.8 /100 | #263 | Tragic $43,000 |
| Immigrants | Liberia | 0.7 /100 | #264 | Tragic $42,923 |
| Salvadorans | 0.7 /100 | #265 | Tragic $42,912 |
Demographics Similar to Chickasaw by Median Earnings
In terms of median earnings, the demographic groups most similar to Chickasaw are Yaqui ($40,647, a difference of 0.060%), Honduran ($40,638, a difference of 0.080%), Cuban ($40,619, a difference of 0.13%), Immigrants from Haiti ($40,550, a difference of 0.30%), and Immigrants from Guatemala ($40,851, a difference of 0.44%).
| Demographics | Rating | Rank | Median Earnings |
| Immigrants | Micronesia | 0.1 /100 | #298 | Tragic $41,133 |
| Immigrants | Caribbean | 0.1 /100 | #299 | Tragic $41,119 |
| Ute | 0.1 /100 | #300 | Tragic $41,051 |
| Immigrants | Latin America | 0.1 /100 | #301 | Tragic $41,049 |
| Shoshone | 0.0 /100 | #302 | Tragic $40,932 |
| Haitians | 0.0 /100 | #303 | Tragic $40,918 |
| Immigrants | Guatemala | 0.0 /100 | #304 | Tragic $40,851 |
| Chickasaw | 0.0 /100 | #305 | Tragic $40,672 |
| Yaqui | 0.0 /100 | #306 | Tragic $40,647 |
| Hondurans | 0.0 /100 | #307 | Tragic $40,638 |
| Cubans | 0.0 /100 | #308 | Tragic $40,619 |
| Immigrants | Haiti | 0.0 /100 | #309 | Tragic $40,550 |
| Apache | 0.0 /100 | #310 | Tragic $40,388 |
| Hispanics or Latinos | 0.0 /100 | #311 | Tragic $40,288 |
| Chippewa | 0.0 /100 | #312 | Tragic $40,287 |