French American Indian vs Bermudan Median Earnings
COMPARE
French American Indian
Bermudan
Median Earnings
Median Earnings Comparison
French American Indians
Bermudans
$43,333
MEDIAN EARNINGS
1.3/ 100
METRIC RATING
258th/ 347
METRIC RANK
$45,593
MEDIAN EARNINGS
23.5/ 100
METRIC RATING
212th/ 347
METRIC RANK
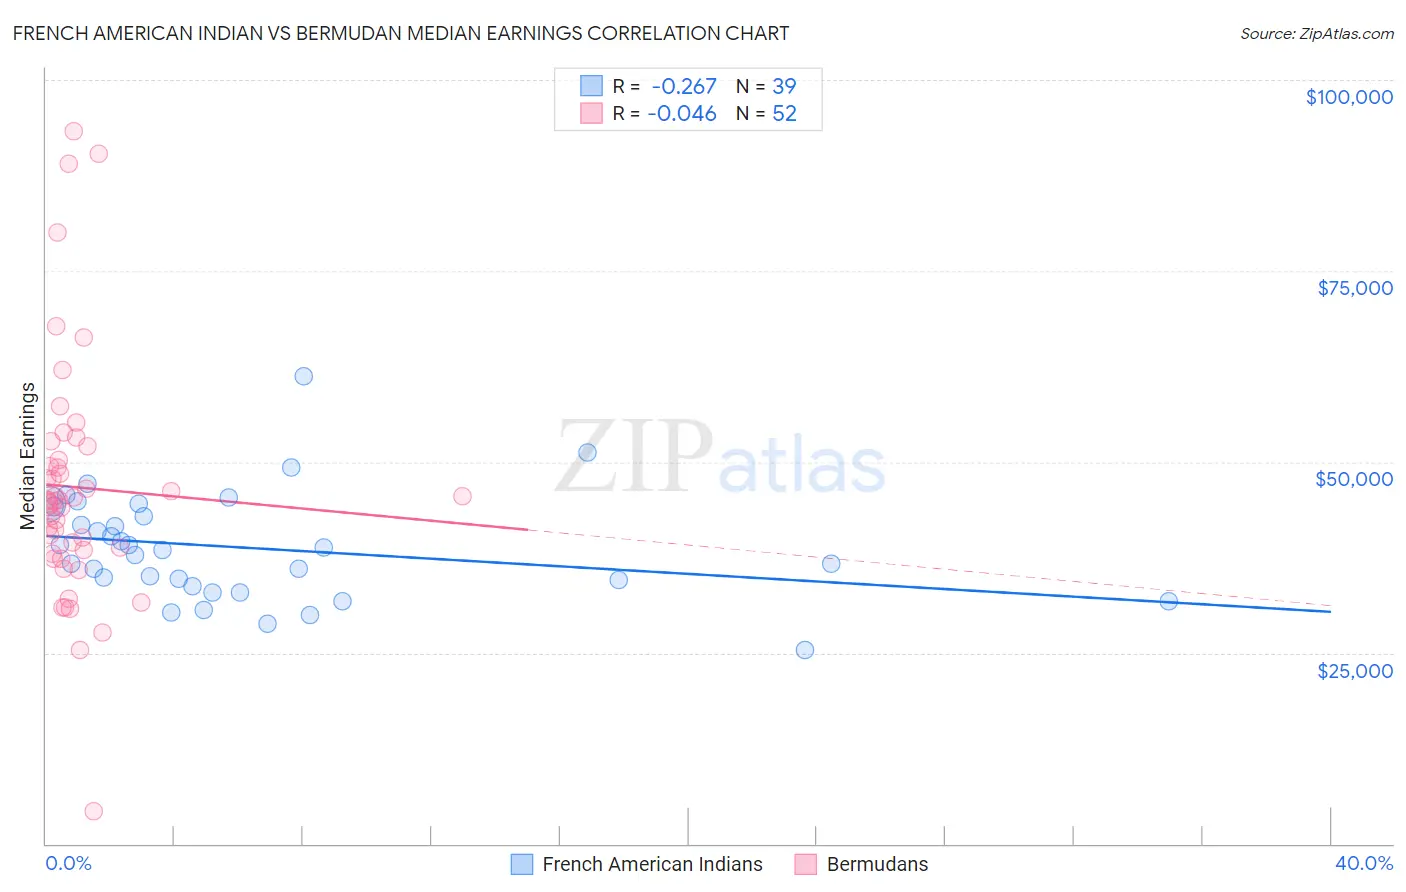
French American Indian vs Bermudan Median Earnings Correlation Chart
The statistical analysis conducted on geographies consisting of 131,971,536 people shows a weak negative correlation between the proportion of French American Indians and median earnings in the United States with a correlation coefficient (R) of -0.267 and weighted average of $43,333. Similarly, the statistical analysis conducted on geographies consisting of 55,730,379 people shows no correlation between the proportion of Bermudans and median earnings in the United States with a correlation coefficient (R) of -0.046 and weighted average of $45,593, a difference of 5.2%.
Median Earnings Correlation Summary
| Measurement | French American Indian | Bermudan |
| Minimum | $25,417 | $4,250 |
| Maximum | $61,250 | $93,350 |
| Range | $35,833 | $89,100 |
| Mean | $38,746 | $46,670 |
| Median | $38,517 | $44,943 |
| Interquartile 25% (IQ1) | $33,745 | $38,258 |
| Interquartile 75% (IQ3) | $44,112 | $51,130 |
| Interquartile Range (IQR) | $10,368 | $12,872 |
| Standard Deviation (Sample) | $7,041 | $16,028 |
| Standard Deviation (Population) | $6,950 | $15,873 |
Similar Demographics by Median Earnings
Demographics Similar to French American Indians by Median Earnings
In terms of median earnings, the demographic groups most similar to French American Indians are Jamaican ($43,343, a difference of 0.020%), Alaskan Athabascan ($43,393, a difference of 0.14%), Immigrants from Middle Africa ($43,416, a difference of 0.19%), German Russian ($43,200, a difference of 0.31%), and Liberian ($43,536, a difference of 0.47%).
| Demographics | Rating | Rank | Median Earnings |
| Tsimshian | 2.1 /100 | #251 | Tragic $43,695 |
| Hawaiians | 2.0 /100 | #252 | Tragic $43,673 |
| Somalis | 1.8 /100 | #253 | Tragic $43,567 |
| Liberians | 1.7 /100 | #254 | Tragic $43,536 |
| Immigrants | Middle Africa | 1.4 /100 | #255 | Tragic $43,416 |
| Alaskan Athabascans | 1.4 /100 | #256 | Tragic $43,393 |
| Jamaicans | 1.3 /100 | #257 | Tragic $43,343 |
| French American Indians | 1.3 /100 | #258 | Tragic $43,333 |
| German Russians | 1.1 /100 | #259 | Tragic $43,200 |
| Immigrants | Somalia | 0.9 /100 | #260 | Tragic $43,100 |
| Immigrants | Jamaica | 0.8 /100 | #261 | Tragic $43,026 |
| Nicaraguans | 0.8 /100 | #262 | Tragic $43,026 |
| Inupiat | 0.8 /100 | #263 | Tragic $43,000 |
| Immigrants | Liberia | 0.7 /100 | #264 | Tragic $42,923 |
| Salvadorans | 0.7 /100 | #265 | Tragic $42,912 |
Demographics Similar to Bermudans by Median Earnings
In terms of median earnings, the demographic groups most similar to Bermudans are Panamanian ($45,593, a difference of 0.0%), Immigrants from Bosnia and Herzegovina ($45,600, a difference of 0.010%), Immigrants from Thailand ($45,598, a difference of 0.010%), Immigrants from Grenada ($45,596, a difference of 0.010%), and Immigrants from Senegal ($45,611, a difference of 0.040%).
| Demographics | Rating | Rank | Median Earnings |
| Tongans | 25.4 /100 | #205 | Fair $45,665 |
| Immigrants | Ghana | 24.8 /100 | #206 | Fair $45,641 |
| Immigrants | Senegal | 24.0 /100 | #207 | Fair $45,611 |
| Immigrants | Bosnia and Herzegovina | 23.7 /100 | #208 | Fair $45,600 |
| Immigrants | Thailand | 23.7 /100 | #209 | Fair $45,598 |
| Immigrants | Grenada | 23.6 /100 | #210 | Fair $45,596 |
| Panamanians | 23.5 /100 | #211 | Fair $45,593 |
| Bermudans | 23.5 /100 | #212 | Fair $45,593 |
| Immigrants | Colombia | 22.4 /100 | #213 | Fair $45,550 |
| Nigerians | 22.0 /100 | #214 | Fair $45,532 |
| Immigrants | Bangladesh | 22.0 /100 | #215 | Fair $45,532 |
| Guyanese | 20.6 /100 | #216 | Fair $45,470 |
| Tlingit-Haida | 20.5 /100 | #217 | Fair $45,468 |
| Spanish | 19.7 /100 | #218 | Poor $45,432 |
| Dutch | 18.4 /100 | #219 | Poor $45,370 |