Ethiopian vs Immigrants from Western Asia Median Male Earnings
COMPARE
Ethiopian
Immigrants from Western Asia
Median Male Earnings
Median Male Earnings Comparison
Ethiopians
Immigrants from Western Asia
$56,243
MEDIAN MALE EARNINGS
84.8/ 100
METRIC RATING
142nd/ 347
METRIC RANK
$58,131
MEDIAN MALE EARNINGS
97.3/ 100
METRIC RATING
105th/ 347
METRIC RANK
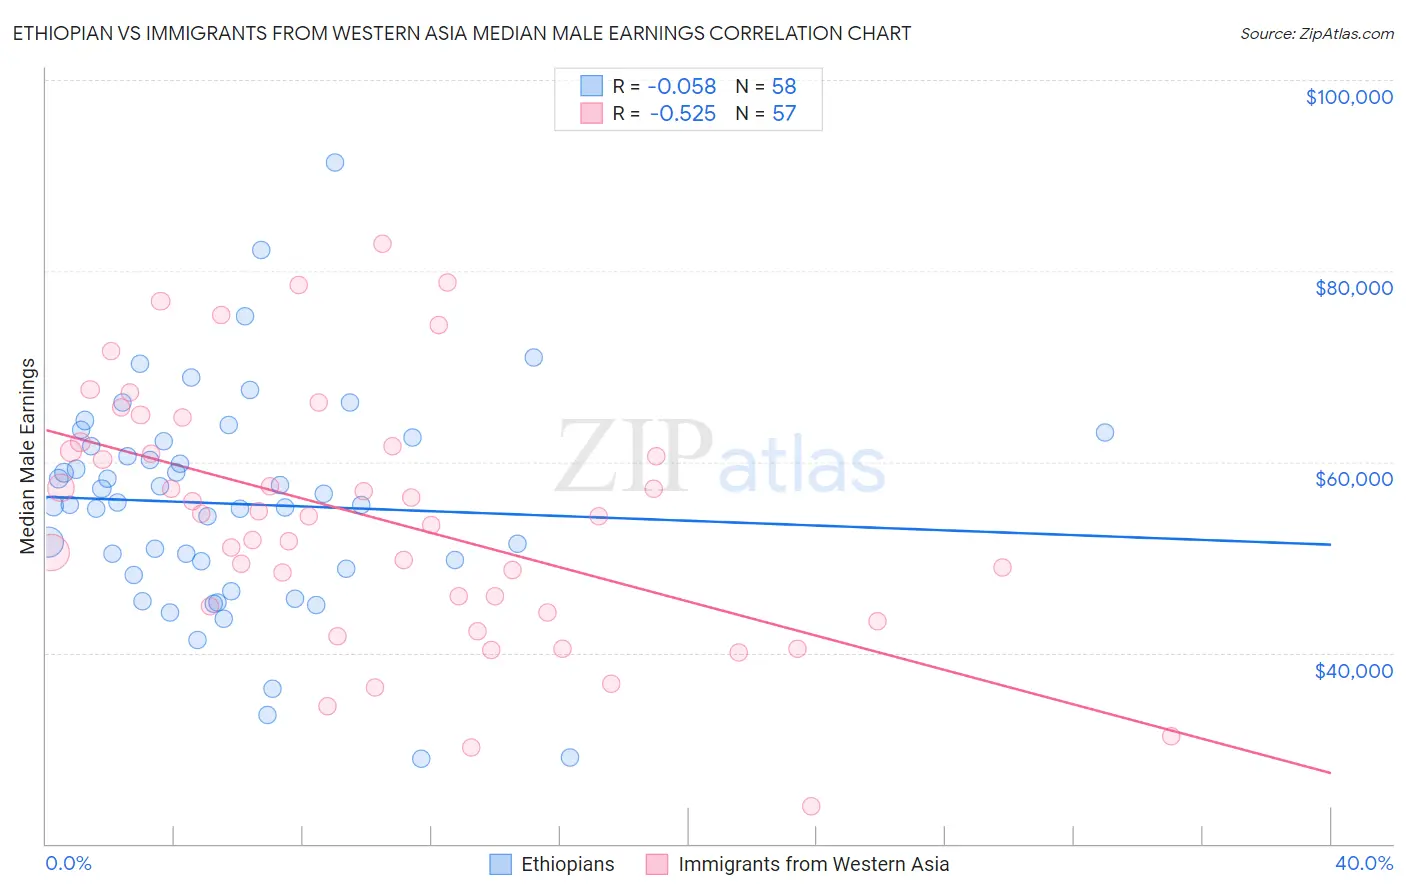
Ethiopian vs Immigrants from Western Asia Median Male Earnings Correlation Chart
The statistical analysis conducted on geographies consisting of 223,246,505 people shows a slight negative correlation between the proportion of Ethiopians and median male earnings in the United States with a correlation coefficient (R) of -0.058 and weighted average of $56,243. Similarly, the statistical analysis conducted on geographies consisting of 404,325,600 people shows a substantial negative correlation between the proportion of Immigrants from Western Asia and median male earnings in the United States with a correlation coefficient (R) of -0.525 and weighted average of $58,131, a difference of 3.4%.
Median Male Earnings Correlation Summary
| Measurement | Ethiopian | Immigrants from Western Asia |
| Minimum | $28,882 | $23,930 |
| Maximum | $91,333 | $82,862 |
| Range | $62,451 | $58,932 |
| Mean | $55,598 | $54,093 |
| Median | $55,634 | $54,361 |
| Interquartile 25% (IQ1) | $48,793 | $44,525 |
| Interquartile 75% (IQ3) | $62,132 | $61,864 |
| Interquartile Range (IQR) | $13,339 | $17,339 |
| Standard Deviation (Sample) | $11,505 | $13,096 |
| Standard Deviation (Population) | $11,405 | $12,981 |
Similar Demographics by Median Male Earnings
Demographics Similar to Ethiopians by Median Male Earnings
In terms of median male earnings, the demographic groups most similar to Ethiopians are Danish ($56,246, a difference of 0.0%), Zimbabwean ($56,302, a difference of 0.10%), Luxembourger ($56,300, a difference of 0.10%), Slovak ($56,306, a difference of 0.11%), and Sri Lankan ($56,136, a difference of 0.19%).
| Demographics | Rating | Rank | Median Male Earnings |
| Irish | 87.4 /100 | #135 | Excellent $56,464 |
| Immigrants | Saudi Arabia | 87.2 /100 | #136 | Excellent $56,452 |
| Slavs | 86.5 /100 | #137 | Excellent $56,390 |
| Slovaks | 85.5 /100 | #138 | Excellent $56,306 |
| Zimbabweans | 85.5 /100 | #139 | Excellent $56,302 |
| Luxembourgers | 85.5 /100 | #140 | Excellent $56,300 |
| Danes | 84.8 /100 | #141 | Excellent $56,246 |
| Ethiopians | 84.8 /100 | #142 | Excellent $56,243 |
| Sri Lankans | 83.4 /100 | #143 | Excellent $56,136 |
| Immigrants | Uganda | 82.4 /100 | #144 | Excellent $56,064 |
| Norwegians | 80.9 /100 | #145 | Excellent $55,965 |
| Immigrants | Chile | 80.7 /100 | #146 | Excellent $55,954 |
| Immigrants | Philippines | 78.4 /100 | #147 | Good $55,809 |
| Scottish | 78.2 /100 | #148 | Good $55,793 |
| English | 77.4 /100 | #149 | Good $55,747 |
Demographics Similar to Immigrants from Western Asia by Median Male Earnings
In terms of median male earnings, the demographic groups most similar to Immigrants from Western Asia are Armenian ($58,134, a difference of 0.010%), Polish ($58,139, a difference of 0.020%), Syrian ($58,187, a difference of 0.10%), Immigrants from Northern Africa ($58,008, a difference of 0.21%), and Serbian ($57,975, a difference of 0.27%).
| Demographics | Rating | Rank | Median Male Earnings |
| Jordanians | 98.1 /100 | #98 | Exceptional $58,500 |
| Immigrants | Poland | 98.0 /100 | #99 | Exceptional $58,452 |
| Assyrians/Chaldeans/Syriacs | 97.9 /100 | #100 | Exceptional $58,437 |
| Immigrants | Brazil | 97.7 /100 | #101 | Exceptional $58,324 |
| Syrians | 97.4 /100 | #102 | Exceptional $58,187 |
| Poles | 97.3 /100 | #103 | Exceptional $58,139 |
| Armenians | 97.3 /100 | #104 | Exceptional $58,134 |
| Immigrants | Western Asia | 97.3 /100 | #105 | Exceptional $58,131 |
| Immigrants | Northern Africa | 96.9 /100 | #106 | Exceptional $58,008 |
| Serbians | 96.8 /100 | #107 | Exceptional $57,975 |
| Immigrants | Uzbekistan | 96.7 /100 | #108 | Exceptional $57,941 |
| British | 96.5 /100 | #109 | Exceptional $57,890 |
| Palestinians | 96.2 /100 | #110 | Exceptional $57,778 |
| Europeans | 95.6 /100 | #111 | Exceptional $57,637 |
| Immigrants | Afghanistan | 95.4 /100 | #112 | Exceptional $57,582 |