Assyrian/Chaldean/Syriac vs Immigrants from Guyana Per Capita Income
COMPARE
Assyrian/Chaldean/Syriac
Immigrants from Guyana
Per Capita Income
Per Capita Income Comparison
Assyrians/Chaldeans/Syriacs
Immigrants from Guyana
$45,195
PER CAPITA INCOME
84.8/ 100
METRIC RATING
138th/ 347
METRIC RANK
$40,742
PER CAPITA INCOME
3.6/ 100
METRIC RATING
235th/ 347
METRIC RANK
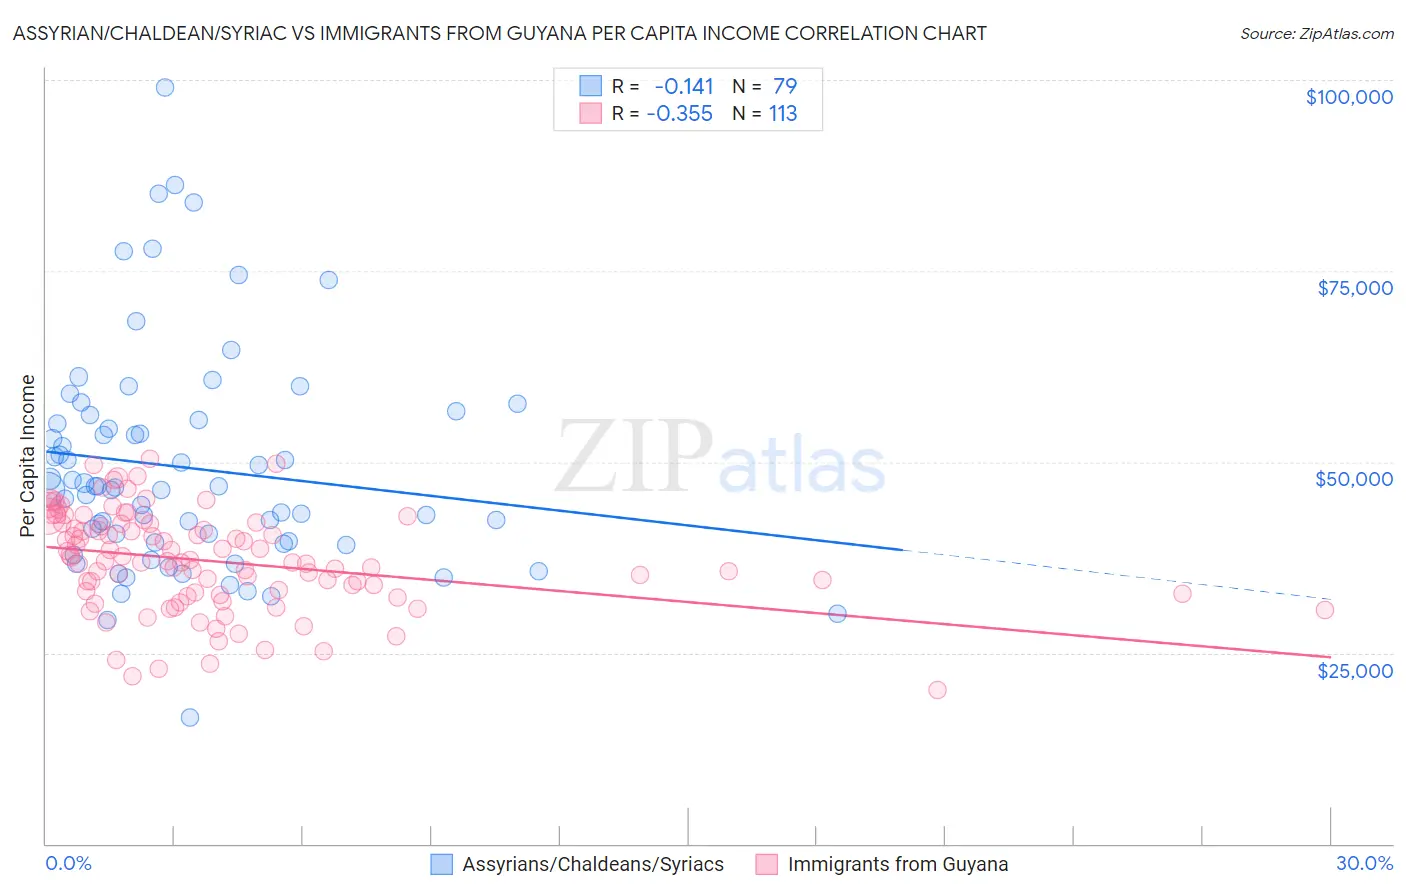
Assyrian/Chaldean/Syriac vs Immigrants from Guyana Per Capita Income Correlation Chart
The statistical analysis conducted on geographies consisting of 110,311,560 people shows a poor negative correlation between the proportion of Assyrians/Chaldeans/Syriacs and per capita income in the United States with a correlation coefficient (R) of -0.141 and weighted average of $45,195. Similarly, the statistical analysis conducted on geographies consisting of 183,742,461 people shows a mild negative correlation between the proportion of Immigrants from Guyana and per capita income in the United States with a correlation coefficient (R) of -0.355 and weighted average of $40,742, a difference of 10.9%.
Per Capita Income Correlation Summary
| Measurement | Assyrian/Chaldean/Syriac | Immigrants from Guyana |
| Minimum | $16,468 | $20,131 |
| Maximum | $99,080 | $50,352 |
| Range | $82,612 | $30,221 |
| Mean | $49,218 | $36,982 |
| Median | $46,715 | $36,920 |
| Interquartile 25% (IQ1) | $39,451 | $32,654 |
| Interquartile 75% (IQ3) | $55,554 | $41,898 |
| Interquartile Range (IQR) | $16,103 | $9,245 |
| Standard Deviation (Sample) | $14,590 | $6,465 |
| Standard Deviation (Population) | $14,497 | $6,436 |
Similar Demographics by Per Capita Income
Demographics Similar to Assyrians/Chaldeans/Syriacs by Per Capita Income
In terms of per capita income, the demographic groups most similar to Assyrians/Chaldeans/Syriacs are Immigrants from Syria ($45,218, a difference of 0.050%), Immigrants from Oceania ($45,220, a difference of 0.060%), Basque ($45,086, a difference of 0.24%), Immigrants from Jordan ($45,066, a difference of 0.29%), and Slavic ($45,049, a difference of 0.32%).
| Demographics | Rating | Rank | Per Capita Income |
| Immigrants | North Macedonia | 90.0 /100 | #131 | Exceptional $45,622 |
| Jordanians | 89.9 /100 | #132 | Excellent $45,605 |
| Pakistanis | 89.7 /100 | #133 | Excellent $45,587 |
| Slovenes | 89.6 /100 | #134 | Excellent $45,581 |
| Hungarians | 87.9 /100 | #135 | Excellent $45,426 |
| Immigrants | Oceania | 85.2 /100 | #136 | Excellent $45,220 |
| Immigrants | Syria | 85.2 /100 | #137 | Excellent $45,218 |
| Assyrians/Chaldeans/Syriacs | 84.8 /100 | #138 | Excellent $45,195 |
| Basques | 83.2 /100 | #139 | Excellent $45,086 |
| Immigrants | Jordan | 82.9 /100 | #140 | Excellent $45,066 |
| Slavs | 82.6 /100 | #141 | Excellent $45,049 |
| Ugandans | 82.6 /100 | #142 | Excellent $45,047 |
| Immigrants | Uganda | 82.5 /100 | #143 | Excellent $45,043 |
| Icelanders | 81.6 /100 | #144 | Excellent $44,987 |
| Immigrants | Afghanistan | 78.0 /100 | #145 | Good $44,790 |
Demographics Similar to Immigrants from Guyana by Per Capita Income
In terms of per capita income, the demographic groups most similar to Immigrants from Guyana are Immigrants from West Indies ($40,763, a difference of 0.050%), Delaware ($40,778, a difference of 0.090%), Nonimmigrants ($40,669, a difference of 0.18%), Guyanese ($40,949, a difference of 0.51%), and Senegalese ($41,000, a difference of 0.63%).
| Demographics | Rating | Rank | Per Capita Income |
| Immigrants | Grenada | 5.5 /100 | #228 | Tragic $41,123 |
| Nigerians | 4.9 /100 | #229 | Tragic $41,026 |
| Native Hawaiians | 4.9 /100 | #230 | Tragic $41,017 |
| Senegalese | 4.8 /100 | #231 | Tragic $41,000 |
| Guyanese | 4.5 /100 | #232 | Tragic $40,949 |
| Delaware | 3.8 /100 | #233 | Tragic $40,778 |
| Immigrants | West Indies | 3.7 /100 | #234 | Tragic $40,763 |
| Immigrants | Guyana | 3.6 /100 | #235 | Tragic $40,742 |
| Immigrants | Nonimmigrants | 3.4 /100 | #236 | Tragic $40,669 |
| Immigrants | Cambodia | 2.6 /100 | #237 | Tragic $40,434 |
| Somalis | 2.4 /100 | #238 | Tragic $40,367 |
| Tsimshian | 2.4 /100 | #239 | Tragic $40,344 |
| Immigrants | Nigeria | 2.3 /100 | #240 | Tragic $40,339 |
| British West Indians | 2.3 /100 | #241 | Tragic $40,330 |
| Immigrants | Western Africa | 2.2 /100 | #242 | Tragic $40,294 |