Ecuadorian vs French American Indian Median Family Income
COMPARE
Ecuadorian
French American Indian
Median Family Income
Median Family Income Comparison
Ecuadorians
French American Indians
$95,114
MEDIAN FAMILY INCOME
2.1/ 100
METRIC RATING
231st/ 347
METRIC RANK
$92,872
MEDIAN FAMILY INCOME
0.7/ 100
METRIC RATING
248th/ 347
METRIC RANK
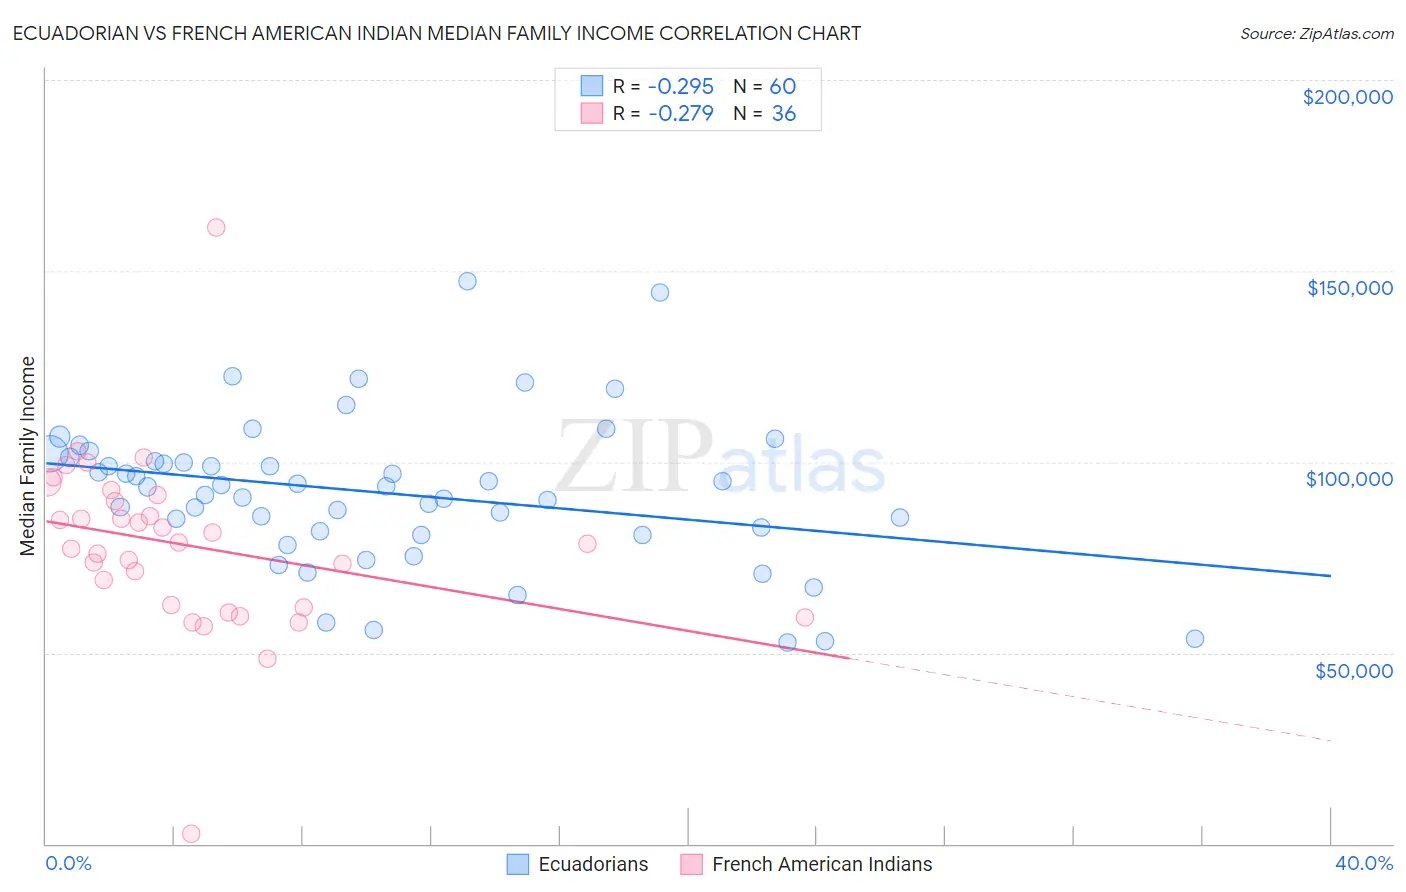
Ecuadorian vs French American Indian Median Family Income Correlation Chart
The statistical analysis conducted on geographies consisting of 317,539,775 people shows a weak negative correlation between the proportion of Ecuadorians and median family income in the United States with a correlation coefficient (R) of -0.295 and weighted average of $95,114. Similarly, the statistical analysis conducted on geographies consisting of 131,949,882 people shows a weak negative correlation between the proportion of French American Indians and median family income in the United States with a correlation coefficient (R) of -0.279 and weighted average of $92,872, a difference of 2.4%.
Median Family Income Correlation Summary
| Measurement | Ecuadorian | French American Indian |
| Minimum | $52,846 | $2,499 |
| Maximum | $147,371 | $161,250 |
| Range | $94,525 | $158,751 |
| Mean | $91,870 | $78,273 |
| Median | $93,530 | $78,700 |
| Interquartile 25% (IQ1) | $81,441 | $62,262 |
| Interquartile 75% (IQ3) | $100,588 | $90,496 |
| Interquartile Range (IQR) | $19,147 | $28,234 |
| Standard Deviation (Sample) | $19,583 | $23,852 |
| Standard Deviation (Population) | $19,420 | $23,519 |
Demographics Similar to Ecuadorians and French American Indians by Median Family Income
In terms of median family income, the demographic groups most similar to Ecuadorians are Malaysian ($95,230, a difference of 0.12%), Marshallese ($95,293, a difference of 0.19%), Immigrants from Venezuela ($94,904, a difference of 0.22%), Immigrants from Bangladesh ($94,665, a difference of 0.47%), and Immigrants from Western Africa ($94,638, a difference of 0.50%). Similarly, the demographic groups most similar to French American Indians are Immigrants from Senegal ($92,912, a difference of 0.040%), Immigrants from Ecuador ($92,837, a difference of 0.040%), Guyanese ($93,373, a difference of 0.54%), Immigrants from Middle Africa ($93,593, a difference of 0.78%), and Subsaharan African ($93,748, a difference of 0.94%).
| Demographics | Rating | Rank | Median Family Income |
| Marshallese | 2.2 /100 | #229 | Tragic $95,293 |
| Malaysians | 2.2 /100 | #230 | Tragic $95,230 |
| Ecuadorians | 2.1 /100 | #231 | Tragic $95,114 |
| Immigrants | Venezuela | 1.9 /100 | #232 | Tragic $94,904 |
| Immigrants | Bangladesh | 1.6 /100 | #233 | Tragic $94,665 |
| Immigrants | Western Africa | 1.6 /100 | #234 | Tragic $94,638 |
| Immigrants | Burma/Myanmar | 1.5 /100 | #235 | Tragic $94,472 |
| Trinidadians and Tobagonians | 1.5 /100 | #236 | Tragic $94,466 |
| Alaskan Athabascans | 1.5 /100 | #237 | Tragic $94,429 |
| Nepalese | 1.3 /100 | #238 | Tragic $94,153 |
| Salvadorans | 1.2 /100 | #239 | Tragic $94,109 |
| Somalis | 1.2 /100 | #240 | Tragic $94,085 |
| Immigrants | Trinidad and Tobago | 1.2 /100 | #241 | Tragic $93,988 |
| Barbadians | 1.1 /100 | #242 | Tragic $93,919 |
| German Russians | 1.1 /100 | #243 | Tragic $93,858 |
| Sub-Saharan Africans | 1.0 /100 | #244 | Tragic $93,748 |
| Immigrants | Middle Africa | 1.0 /100 | #245 | Tragic $93,593 |
| Guyanese | 0.9 /100 | #246 | Tragic $93,373 |
| Immigrants | Senegal | 0.7 /100 | #247 | Tragic $92,912 |
| French American Indians | 0.7 /100 | #248 | Tragic $92,872 |
| Immigrants | Ecuador | 0.7 /100 | #249 | Tragic $92,837 |