Ecuadorian vs Immigrants from Costa Rica Median Family Income
COMPARE
Ecuadorian
Immigrants from Costa Rica
Median Family Income
Median Family Income Comparison
Ecuadorians
Immigrants from Costa Rica
$95,114
MEDIAN FAMILY INCOME
2.1/ 100
METRIC RATING
231st/ 347
METRIC RANK
$101,354
MEDIAN FAMILY INCOME
33.7/ 100
METRIC RATING
184th/ 347
METRIC RANK
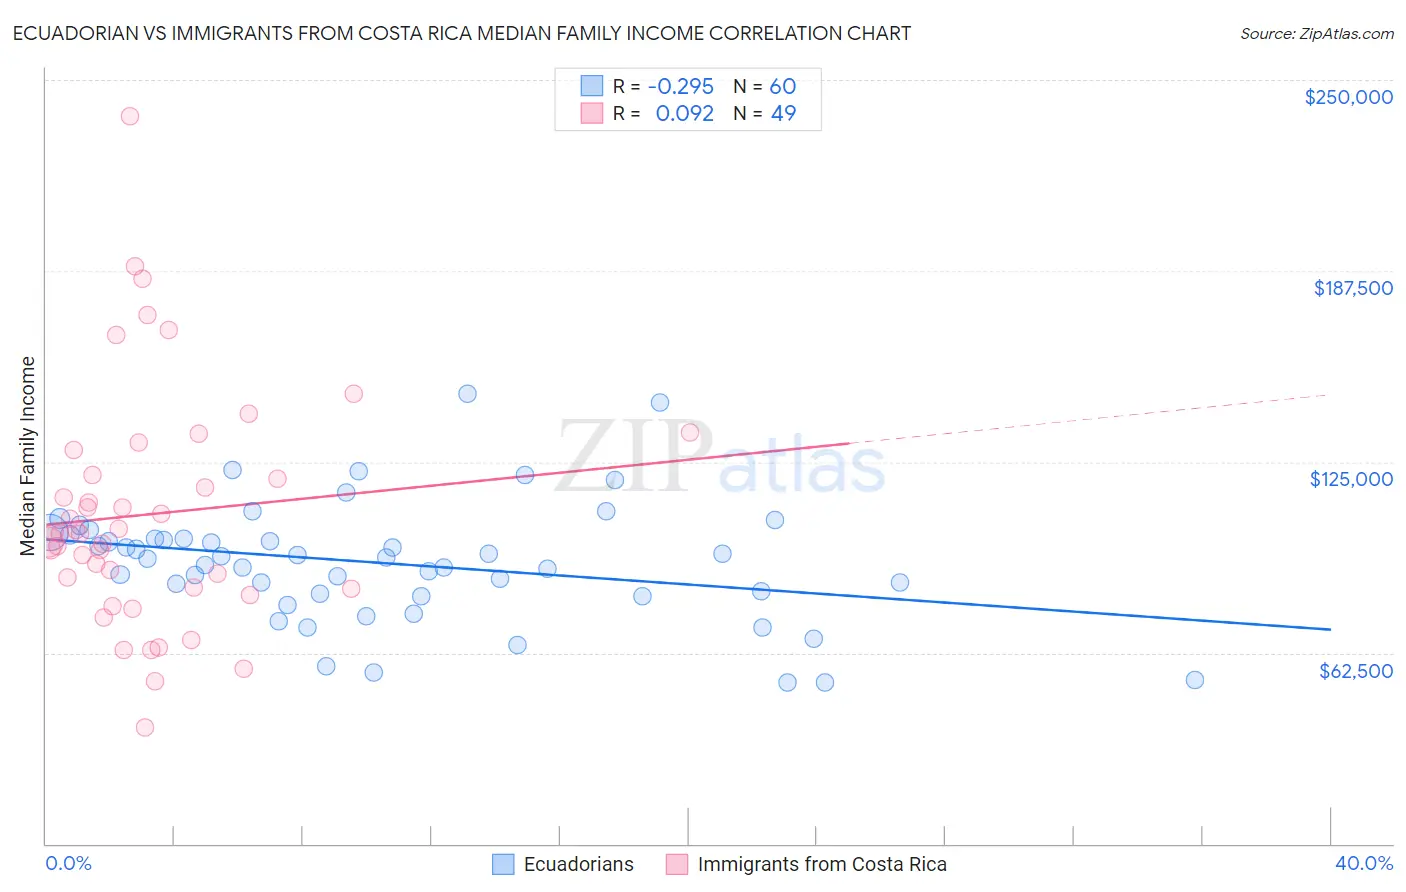
Ecuadorian vs Immigrants from Costa Rica Median Family Income Correlation Chart
The statistical analysis conducted on geographies consisting of 317,539,775 people shows a weak negative correlation between the proportion of Ecuadorians and median family income in the United States with a correlation coefficient (R) of -0.295 and weighted average of $95,114. Similarly, the statistical analysis conducted on geographies consisting of 204,217,887 people shows a slight positive correlation between the proportion of Immigrants from Costa Rica and median family income in the United States with a correlation coefficient (R) of 0.092 and weighted average of $101,354, a difference of 6.6%.
Median Family Income Correlation Summary
| Measurement | Ecuadorian | Immigrants from Costa Rica |
| Minimum | $52,846 | $37,917 |
| Maximum | $147,371 | $238,052 |
| Range | $94,525 | $200,135 |
| Mean | $91,870 | $107,880 |
| Median | $93,530 | $101,496 |
| Interquartile 25% (IQ1) | $81,441 | $83,552 |
| Interquartile 75% (IQ3) | $100,588 | $124,823 |
| Interquartile Range (IQR) | $19,147 | $41,271 |
| Standard Deviation (Sample) | $19,583 | $38,589 |
| Standard Deviation (Population) | $19,420 | $38,194 |
Similar Demographics by Median Family Income
Demographics Similar to Ecuadorians by Median Family Income
In terms of median family income, the demographic groups most similar to Ecuadorians are Malaysian ($95,230, a difference of 0.12%), Marshallese ($95,293, a difference of 0.19%), Immigrants from Venezuela ($94,904, a difference of 0.22%), Immigrants from the Azores ($95,402, a difference of 0.30%), and Immigrants from Bangladesh ($94,665, a difference of 0.47%).
| Demographics | Rating | Rank | Median Family Income |
| Immigrants | Nonimmigrants | 3.6 /100 | #224 | Tragic $96,231 |
| Vietnamese | 3.4 /100 | #225 | Tragic $96,123 |
| Immigrants | Panama | 2.7 /100 | #226 | Tragic $95,647 |
| Alaska Natives | 2.6 /100 | #227 | Tragic $95,573 |
| Immigrants | Azores | 2.4 /100 | #228 | Tragic $95,402 |
| Marshallese | 2.2 /100 | #229 | Tragic $95,293 |
| Malaysians | 2.2 /100 | #230 | Tragic $95,230 |
| Ecuadorians | 2.1 /100 | #231 | Tragic $95,114 |
| Immigrants | Venezuela | 1.9 /100 | #232 | Tragic $94,904 |
| Immigrants | Bangladesh | 1.6 /100 | #233 | Tragic $94,665 |
| Immigrants | Western Africa | 1.6 /100 | #234 | Tragic $94,638 |
| Immigrants | Burma/Myanmar | 1.5 /100 | #235 | Tragic $94,472 |
| Trinidadians and Tobagonians | 1.5 /100 | #236 | Tragic $94,466 |
| Alaskan Athabascans | 1.5 /100 | #237 | Tragic $94,429 |
| Nepalese | 1.3 /100 | #238 | Tragic $94,153 |
Demographics Similar to Immigrants from Costa Rica by Median Family Income
In terms of median family income, the demographic groups most similar to Immigrants from Costa Rica are Kenyan ($101,417, a difference of 0.060%), Dutch ($101,192, a difference of 0.16%), Tsimshian ($101,543, a difference of 0.19%), Celtic ($101,139, a difference of 0.21%), and Spaniard ($101,617, a difference of 0.26%).
| Demographics | Rating | Rank | Median Family Income |
| Germans | 44.6 /100 | #177 | Average $102,254 |
| Welsh | 43.3 /100 | #178 | Average $102,151 |
| South Americans | 39.7 /100 | #179 | Fair $101,856 |
| French Canadians | 37.0 /100 | #180 | Fair $101,634 |
| Spaniards | 36.8 /100 | #181 | Fair $101,617 |
| Tsimshian | 35.9 /100 | #182 | Fair $101,543 |
| Kenyans | 34.5 /100 | #183 | Fair $101,417 |
| Immigrants | Costa Rica | 33.7 /100 | #184 | Fair $101,354 |
| Dutch | 31.9 /100 | #185 | Fair $101,192 |
| Celtics | 31.3 /100 | #186 | Fair $101,139 |
| Tlingit-Haida | 30.8 /100 | #187 | Fair $101,092 |
| Guamanians/Chamorros | 30.5 /100 | #188 | Fair $101,061 |
| Immigrants | Portugal | 29.6 /100 | #189 | Fair $100,984 |
| Immigrants | Immigrants | 29.4 /100 | #190 | Fair $100,962 |
| Colombians | 27.2 /100 | #191 | Fair $100,750 |