Dutch vs Immigrants from Serbia Median Family Income
COMPARE
Dutch
Immigrants from Serbia
Median Family Income
Median Family Income Comparison
Dutch
Immigrants from Serbia
$101,192
MEDIAN FAMILY INCOME
31.9/ 100
METRIC RATING
185th/ 347
METRIC RANK
$113,463
MEDIAN FAMILY INCOME
99.6/ 100
METRIC RATING
68th/ 347
METRIC RANK
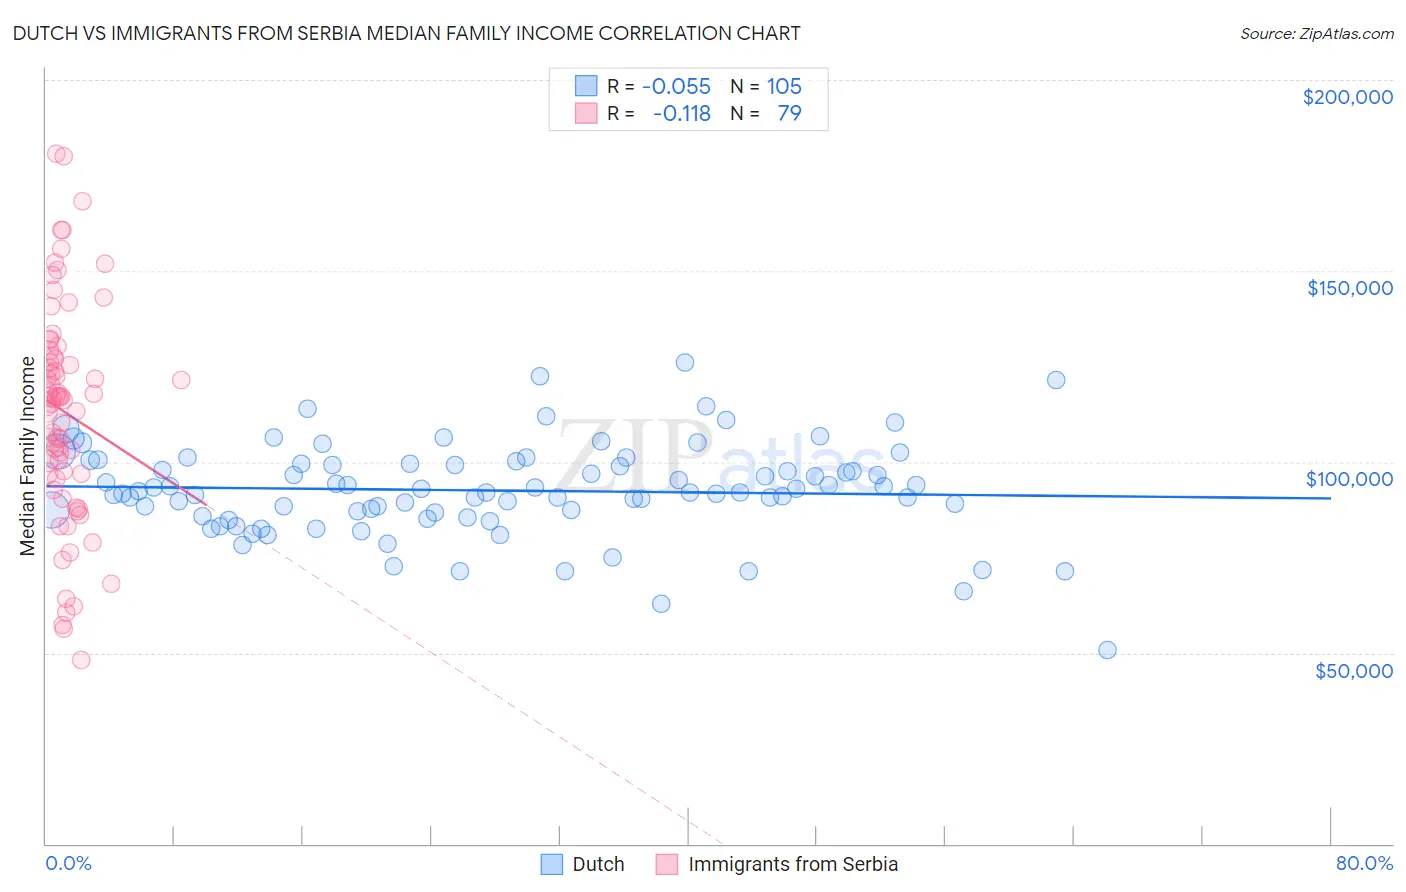
Dutch vs Immigrants from Serbia Median Family Income Correlation Chart
The statistical analysis conducted on geographies consisting of 553,300,632 people shows a slight negative correlation between the proportion of Dutch and median family income in the United States with a correlation coefficient (R) of -0.055 and weighted average of $101,192. Similarly, the statistical analysis conducted on geographies consisting of 131,712,568 people shows a poor negative correlation between the proportion of Immigrants from Serbia and median family income in the United States with a correlation coefficient (R) of -0.118 and weighted average of $113,463, a difference of 12.1%.
Median Family Income Correlation Summary
| Measurement | Dutch | Immigrants from Serbia |
| Minimum | $50,679 | $48,194 |
| Maximum | $126,042 | $180,588 |
| Range | $75,363 | $132,394 |
| Mean | $92,505 | $113,133 |
| Median | $92,000 | $116,433 |
| Interquartile 25% (IQ1) | $86,239 | $96,750 |
| Interquartile 75% (IQ3) | $99,471 | $127,696 |
| Interquartile Range (IQR) | $13,232 | $30,946 |
| Standard Deviation (Sample) | $12,293 | $28,356 |
| Standard Deviation (Population) | $12,235 | $28,176 |
Similar Demographics by Median Family Income
Demographics Similar to Dutch by Median Family Income
In terms of median family income, the demographic groups most similar to Dutch are Celtic ($101,139, a difference of 0.050%), Tlingit-Haida ($101,092, a difference of 0.10%), Guamanian/Chamorro ($101,061, a difference of 0.13%), Immigrants from Costa Rica ($101,354, a difference of 0.16%), and Immigrants from Portugal ($100,984, a difference of 0.21%).
| Demographics | Rating | Rank | Median Family Income |
| Welsh | 43.3 /100 | #178 | Average $102,151 |
| South Americans | 39.7 /100 | #179 | Fair $101,856 |
| French Canadians | 37.0 /100 | #180 | Fair $101,634 |
| Spaniards | 36.8 /100 | #181 | Fair $101,617 |
| Tsimshian | 35.9 /100 | #182 | Fair $101,543 |
| Kenyans | 34.5 /100 | #183 | Fair $101,417 |
| Immigrants | Costa Rica | 33.7 /100 | #184 | Fair $101,354 |
| Dutch | 31.9 /100 | #185 | Fair $101,192 |
| Celtics | 31.3 /100 | #186 | Fair $101,139 |
| Tlingit-Haida | 30.8 /100 | #187 | Fair $101,092 |
| Guamanians/Chamorros | 30.5 /100 | #188 | Fair $101,061 |
| Immigrants | Portugal | 29.6 /100 | #189 | Fair $100,984 |
| Immigrants | Immigrants | 29.4 /100 | #190 | Fair $100,962 |
| Colombians | 27.2 /100 | #191 | Fair $100,750 |
| Immigrants | Kenya | 26.5 /100 | #192 | Fair $100,679 |
Demographics Similar to Immigrants from Serbia by Median Family Income
In terms of median family income, the demographic groups most similar to Immigrants from Serbia are Immigrants from Bulgaria ($113,461, a difference of 0.0%), Immigrants from Romania ($113,434, a difference of 0.030%), South African ($113,229, a difference of 0.21%), Immigrants from Spain ($113,815, a difference of 0.31%), and Afghan ($112,971, a difference of 0.44%).
| Demographics | Rating | Rank | Median Family Income |
| Immigrants | Belarus | 99.8 /100 | #61 | Exceptional $114,586 |
| Mongolians | 99.8 /100 | #62 | Exceptional $114,553 |
| Immigrants | Pakistan | 99.8 /100 | #63 | Exceptional $114,406 |
| Immigrants | Scotland | 99.7 /100 | #64 | Exceptional $114,392 |
| Egyptians | 99.7 /100 | #65 | Exceptional $114,119 |
| Paraguayans | 99.7 /100 | #66 | Exceptional $114,016 |
| Immigrants | Spain | 99.7 /100 | #67 | Exceptional $113,815 |
| Immigrants | Serbia | 99.6 /100 | #68 | Exceptional $113,463 |
| Immigrants | Bulgaria | 99.6 /100 | #69 | Exceptional $113,461 |
| Immigrants | Romania | 99.6 /100 | #70 | Exceptional $113,434 |
| South Africans | 99.5 /100 | #71 | Exceptional $113,229 |
| Afghans | 99.5 /100 | #72 | Exceptional $112,971 |
| Laotians | 99.5 /100 | #73 | Exceptional $112,859 |
| Immigrants | Italy | 99.4 /100 | #74 | Exceptional $112,848 |
| Immigrants | Western Europe | 99.4 /100 | #75 | Exceptional $112,688 |