Dutch vs West Indian Median Family Income
COMPARE
Dutch
West Indian
Median Family Income
Median Family Income Comparison
Dutch
West Indians
$101,192
MEDIAN FAMILY INCOME
31.9/ 100
METRIC RATING
185th/ 347
METRIC RANK
$92,765
MEDIAN FAMILY INCOME
0.6/ 100
METRIC RATING
250th/ 347
METRIC RANK
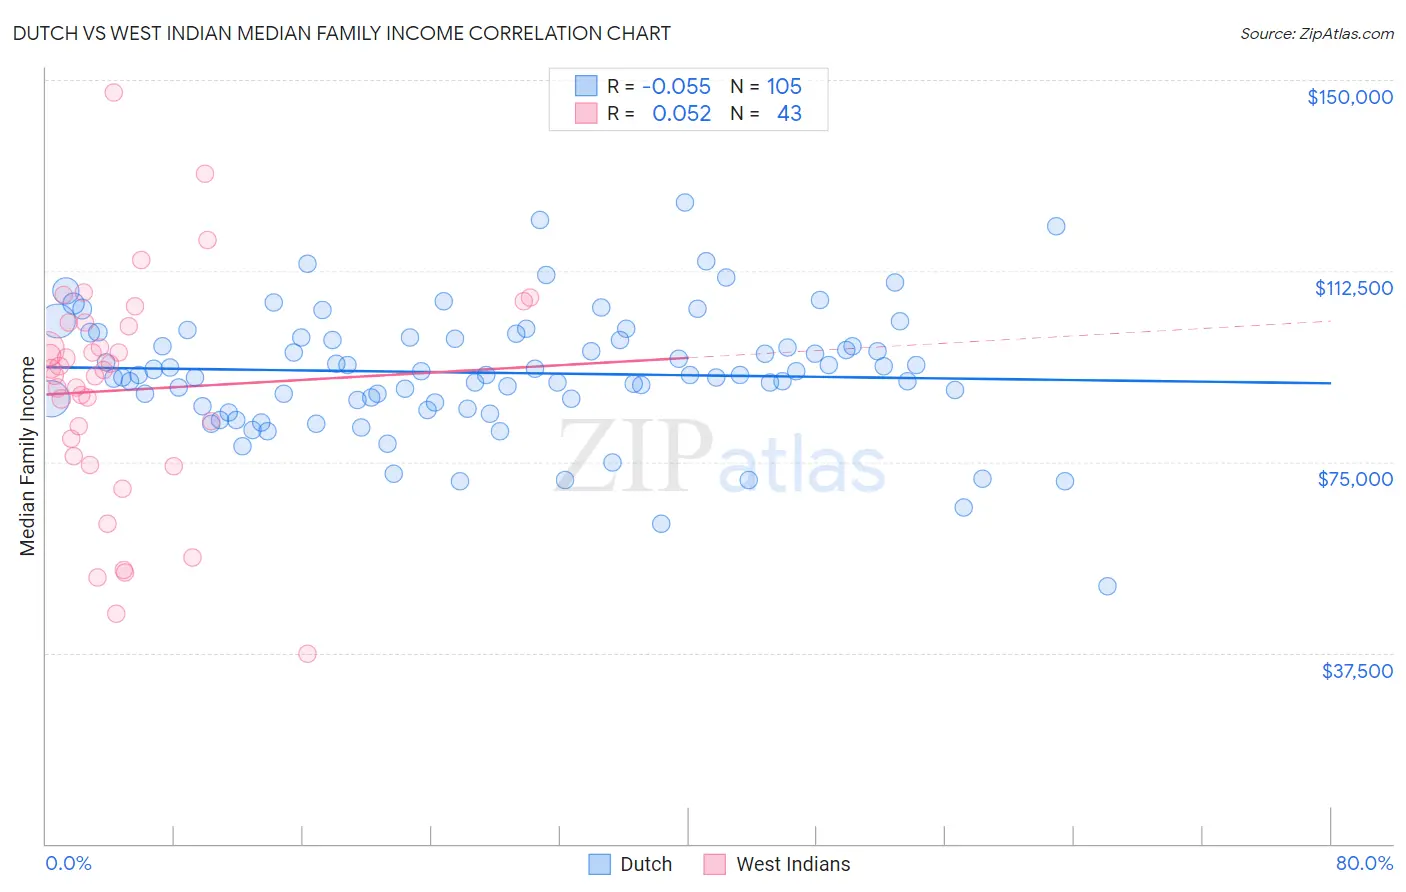
Dutch vs West Indian Median Family Income Correlation Chart
The statistical analysis conducted on geographies consisting of 553,300,632 people shows a slight negative correlation between the proportion of Dutch and median family income in the United States with a correlation coefficient (R) of -0.055 and weighted average of $101,192. Similarly, the statistical analysis conducted on geographies consisting of 253,786,025 people shows a slight positive correlation between the proportion of West Indians and median family income in the United States with a correlation coefficient (R) of 0.052 and weighted average of $92,765, a difference of 9.1%.
Median Family Income Correlation Summary
| Measurement | Dutch | West Indian |
| Minimum | $50,679 | $37,244 |
| Maximum | $126,042 | $147,600 |
| Range | $75,363 | $110,356 |
| Mean | $92,505 | $89,153 |
| Median | $92,000 | $92,948 |
| Interquartile 25% (IQ1) | $86,239 | $76,053 |
| Interquartile 75% (IQ3) | $99,471 | $102,268 |
| Interquartile Range (IQR) | $13,232 | $26,215 |
| Standard Deviation (Sample) | $12,293 | $22,238 |
| Standard Deviation (Population) | $12,235 | $21,978 |
Similar Demographics by Median Family Income
Demographics Similar to Dutch by Median Family Income
In terms of median family income, the demographic groups most similar to Dutch are Celtic ($101,139, a difference of 0.050%), Tlingit-Haida ($101,092, a difference of 0.10%), Guamanian/Chamorro ($101,061, a difference of 0.13%), Immigrants from Costa Rica ($101,354, a difference of 0.16%), and Immigrants from Portugal ($100,984, a difference of 0.21%).
| Demographics | Rating | Rank | Median Family Income |
| Welsh | 43.3 /100 | #178 | Average $102,151 |
| South Americans | 39.7 /100 | #179 | Fair $101,856 |
| French Canadians | 37.0 /100 | #180 | Fair $101,634 |
| Spaniards | 36.8 /100 | #181 | Fair $101,617 |
| Tsimshian | 35.9 /100 | #182 | Fair $101,543 |
| Kenyans | 34.5 /100 | #183 | Fair $101,417 |
| Immigrants | Costa Rica | 33.7 /100 | #184 | Fair $101,354 |
| Dutch | 31.9 /100 | #185 | Fair $101,192 |
| Celtics | 31.3 /100 | #186 | Fair $101,139 |
| Tlingit-Haida | 30.8 /100 | #187 | Fair $101,092 |
| Guamanians/Chamorros | 30.5 /100 | #188 | Fair $101,061 |
| Immigrants | Portugal | 29.6 /100 | #189 | Fair $100,984 |
| Immigrants | Immigrants | 29.4 /100 | #190 | Fair $100,962 |
| Colombians | 27.2 /100 | #191 | Fair $100,750 |
| Immigrants | Kenya | 26.5 /100 | #192 | Fair $100,679 |
Demographics Similar to West Indians by Median Family Income
In terms of median family income, the demographic groups most similar to West Indians are Immigrants from Ecuador ($92,837, a difference of 0.080%), French American Indian ($92,872, a difference of 0.11%), Immigrants from Senegal ($92,912, a difference of 0.16%), Immigrants from Somalia ($92,609, a difference of 0.17%), and Immigrants from El Salvador ($92,545, a difference of 0.24%).
| Demographics | Rating | Rank | Median Family Income |
| German Russians | 1.1 /100 | #243 | Tragic $93,858 |
| Sub-Saharan Africans | 1.0 /100 | #244 | Tragic $93,748 |
| Immigrants | Middle Africa | 1.0 /100 | #245 | Tragic $93,593 |
| Guyanese | 0.9 /100 | #246 | Tragic $93,373 |
| Immigrants | Senegal | 0.7 /100 | #247 | Tragic $92,912 |
| French American Indians | 0.7 /100 | #248 | Tragic $92,872 |
| Immigrants | Ecuador | 0.7 /100 | #249 | Tragic $92,837 |
| West Indians | 0.6 /100 | #250 | Tragic $92,765 |
| Immigrants | Somalia | 0.6 /100 | #251 | Tragic $92,609 |
| Immigrants | El Salvador | 0.6 /100 | #252 | Tragic $92,545 |
| Immigrants | Guyana | 0.6 /100 | #253 | Tragic $92,513 |
| Immigrants | Barbados | 0.5 /100 | #254 | Tragic $92,419 |
| Immigrants | Laos | 0.5 /100 | #255 | Tragic $92,239 |
| Nicaraguans | 0.5 /100 | #256 | Tragic $92,231 |
| Americans | 0.4 /100 | #257 | Tragic $92,096 |