Creek vs Immigrants from Zimbabwe Median Household Income
COMPARE
Creek
Immigrants from Zimbabwe
Median Household Income
Median Household Income Comparison
Creek
Immigrants from Zimbabwe
$67,715
MEDIAN HOUSEHOLD INCOME
0.0/ 100
METRIC RATING
333rd/ 347
METRIC RANK
$89,496
MEDIAN HOUSEHOLD INCOME
94.4/ 100
METRIC RATING
123rd/ 347
METRIC RANK
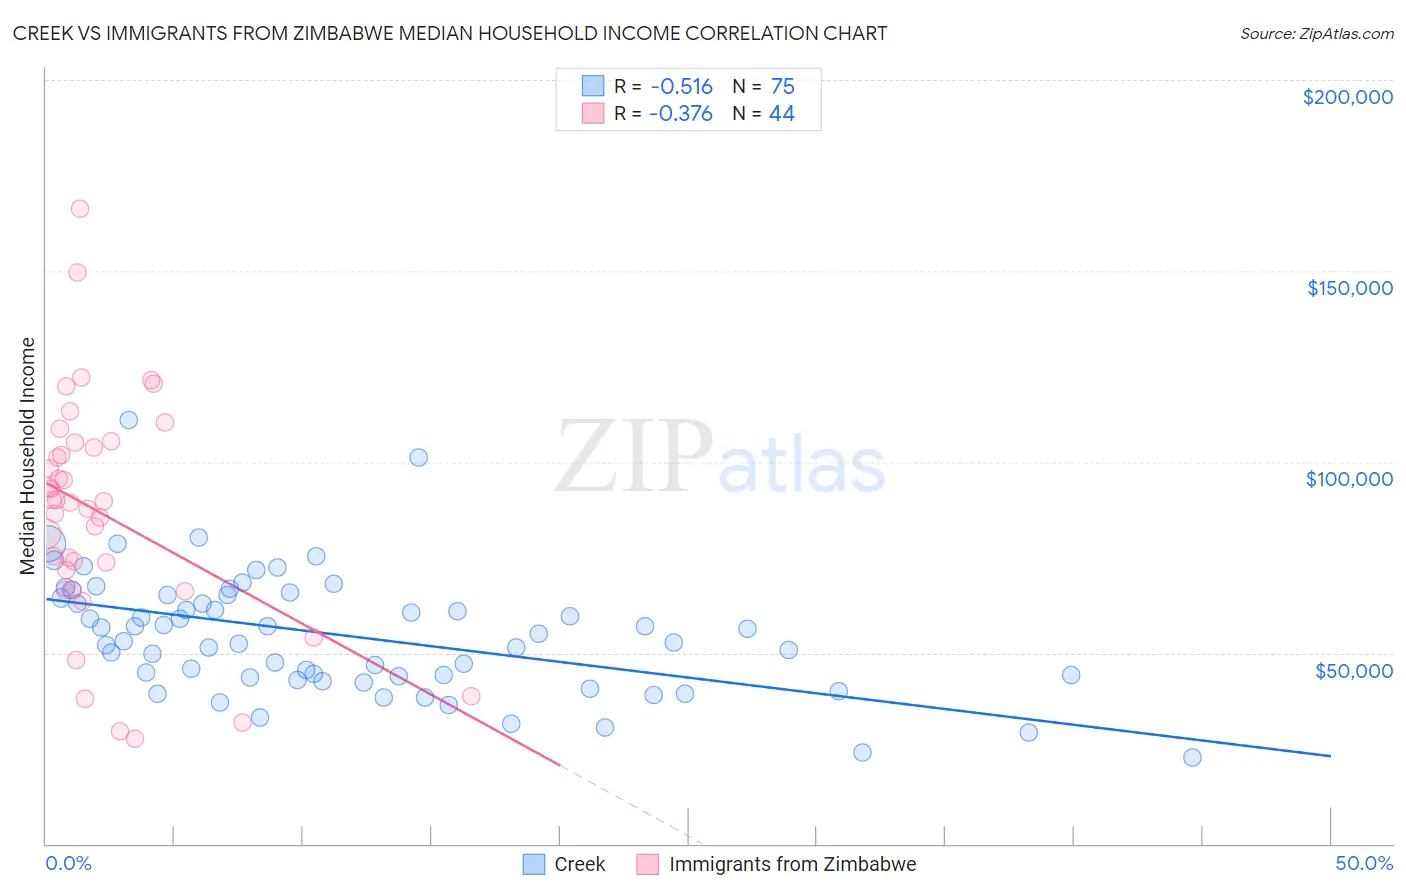
Creek vs Immigrants from Zimbabwe Median Household Income Correlation Chart
The statistical analysis conducted on geographies consisting of 178,405,677 people shows a substantial negative correlation between the proportion of Creek and median household income in the United States with a correlation coefficient (R) of -0.516 and weighted average of $67,715. Similarly, the statistical analysis conducted on geographies consisting of 117,782,867 people shows a mild negative correlation between the proportion of Immigrants from Zimbabwe and median household income in the United States with a correlation coefficient (R) of -0.376 and weighted average of $89,496, a difference of 32.2%.
Median Household Income Correlation Summary
| Measurement | Creek | Immigrants from Zimbabwe |
| Minimum | $22,500 | $27,656 |
| Maximum | $111,063 | $166,303 |
| Range | $88,563 | $138,647 |
| Mean | $54,543 | $86,538 |
| Median | $53,166 | $89,467 |
| Interquartile 25% (IQ1) | $43,621 | $69,146 |
| Interquartile 75% (IQ3) | $65,130 | $104,418 |
| Interquartile Range (IQR) | $21,509 | $35,272 |
| Standard Deviation (Sample) | $15,915 | $29,812 |
| Standard Deviation (Population) | $15,809 | $29,471 |
Similar Demographics by Median Household Income
Demographics Similar to Creek by Median Household Income
In terms of median household income, the demographic groups most similar to Creek are Sioux ($67,792, a difference of 0.11%), Black/African American ($67,573, a difference of 0.21%), Native/Alaskan ($67,879, a difference of 0.24%), Arapaho ($67,965, a difference of 0.37%), and Dutch West Indian ($68,412, a difference of 1.0%).
| Demographics | Rating | Rank | Median Household Income |
| Yuman | 0.0 /100 | #326 | Tragic $68,743 |
| Immigrants | Cuba | 0.0 /100 | #327 | Tragic $68,461 |
| Menominee | 0.0 /100 | #328 | Tragic $68,423 |
| Dutch West Indians | 0.0 /100 | #329 | Tragic $68,412 |
| Arapaho | 0.0 /100 | #330 | Tragic $67,965 |
| Natives/Alaskans | 0.0 /100 | #331 | Tragic $67,879 |
| Sioux | 0.0 /100 | #332 | Tragic $67,792 |
| Creek | 0.0 /100 | #333 | Tragic $67,715 |
| Blacks/African Americans | 0.0 /100 | #334 | Tragic $67,573 |
| Cheyenne | 0.0 /100 | #335 | Tragic $66,974 |
| Immigrants | Congo | 0.0 /100 | #336 | Tragic $66,768 |
| Kiowa | 0.0 /100 | #337 | Tragic $65,914 |
| Immigrants | Yemen | 0.0 /100 | #338 | Tragic $65,194 |
| Hopi | 0.0 /100 | #339 | Tragic $65,043 |
| Pueblo | 0.0 /100 | #340 | Tragic $64,692 |
Demographics Similar to Immigrants from Zimbabwe by Median Household Income
In terms of median household income, the demographic groups most similar to Immigrants from Zimbabwe are Immigrants from Jordan ($89,412, a difference of 0.090%), Ethiopian ($89,640, a difference of 0.16%), Pakistani ($89,638, a difference of 0.16%), Immigrants from Kuwait ($89,263, a difference of 0.26%), and Immigrants from North Macedonia ($89,741, a difference of 0.27%).
| Demographics | Rating | Rank | Median Household Income |
| Native Hawaiians | 95.7 /100 | #116 | Exceptional $89,919 |
| Taiwanese | 95.6 /100 | #117 | Exceptional $89,900 |
| Syrians | 95.4 /100 | #118 | Exceptional $89,830 |
| Albanians | 95.2 /100 | #119 | Exceptional $89,744 |
| Immigrants | North Macedonia | 95.2 /100 | #120 | Exceptional $89,741 |
| Ethiopians | 94.9 /100 | #121 | Exceptional $89,640 |
| Pakistanis | 94.8 /100 | #122 | Exceptional $89,638 |
| Immigrants | Zimbabwe | 94.4 /100 | #123 | Exceptional $89,496 |
| Immigrants | Jordan | 94.1 /100 | #124 | Exceptional $89,412 |
| Immigrants | Kuwait | 93.5 /100 | #125 | Exceptional $89,263 |
| Immigrants | Oceania | 92.9 /100 | #126 | Exceptional $89,100 |
| Immigrants | Peru | 92.5 /100 | #127 | Exceptional $89,010 |
| Portuguese | 92.3 /100 | #128 | Exceptional $88,976 |
| Brazilians | 92.1 /100 | #129 | Exceptional $88,934 |
| British | 92.0 /100 | #130 | Exceptional $88,914 |