Spanish vs Immigrants from Zimbabwe Median Household Income
COMPARE
Spanish
Immigrants from Zimbabwe
Median Household Income
Median Household Income Comparison
Spanish
Immigrants from Zimbabwe
$83,343
MEDIAN HOUSEHOLD INCOME
24.4/ 100
METRIC RATING
201st/ 347
METRIC RANK
$89,496
MEDIAN HOUSEHOLD INCOME
94.4/ 100
METRIC RATING
123rd/ 347
METRIC RANK
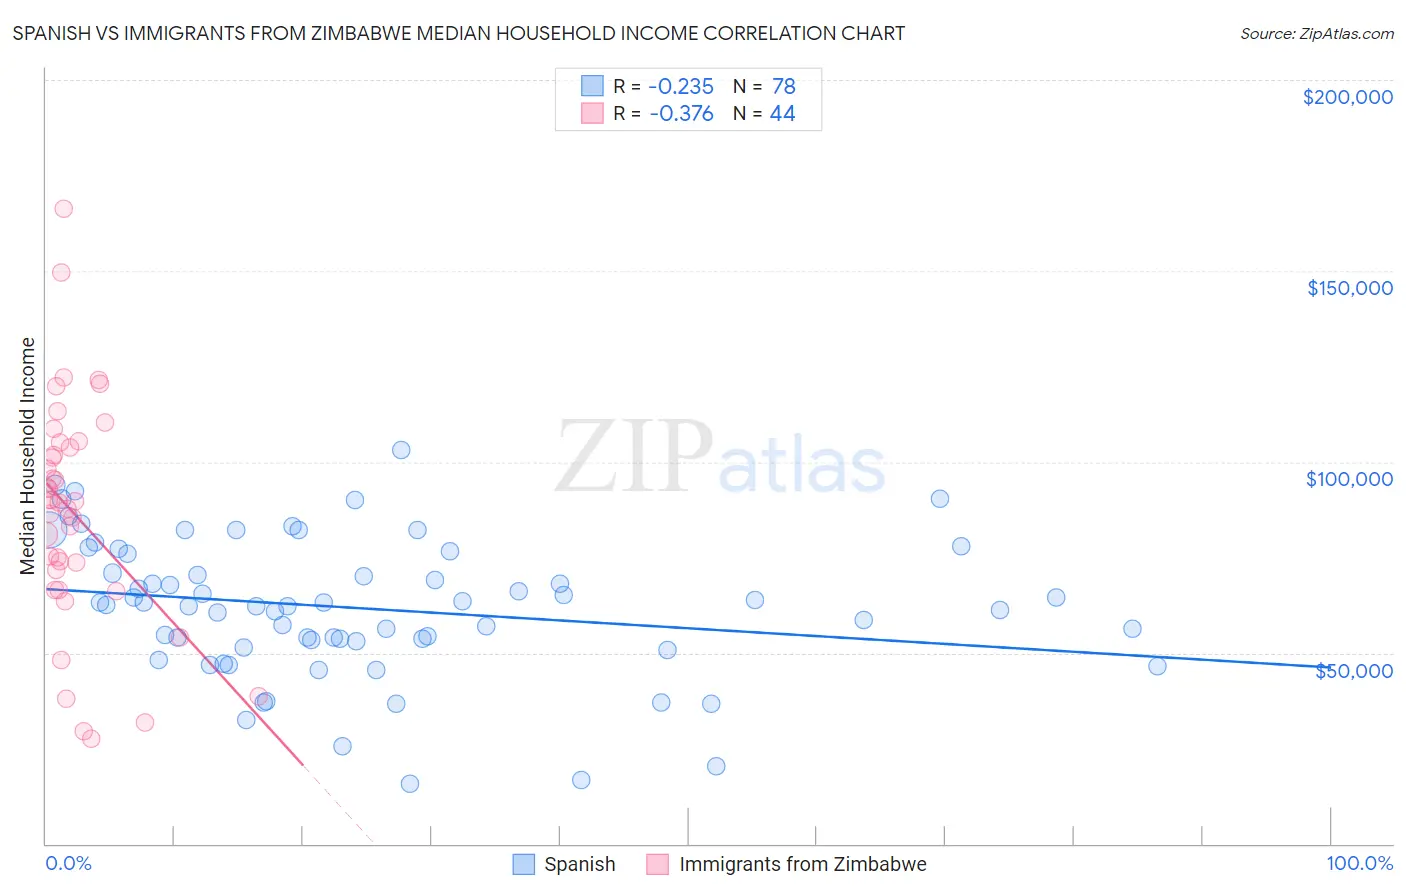
Spanish vs Immigrants from Zimbabwe Median Household Income Correlation Chart
The statistical analysis conducted on geographies consisting of 421,807,066 people shows a weak negative correlation between the proportion of Spanish and median household income in the United States with a correlation coefficient (R) of -0.235 and weighted average of $83,343. Similarly, the statistical analysis conducted on geographies consisting of 117,782,867 people shows a mild negative correlation between the proportion of Immigrants from Zimbabwe and median household income in the United States with a correlation coefficient (R) of -0.376 and weighted average of $89,496, a difference of 7.4%.
Median Household Income Correlation Summary
| Measurement | Spanish | Immigrants from Zimbabwe |
| Minimum | $15,577 | $27,656 |
| Maximum | $103,194 | $166,303 |
| Range | $87,617 | $138,647 |
| Mean | $61,640 | $86,538 |
| Median | $62,411 | $89,467 |
| Interquartile 25% (IQ1) | $53,047 | $69,146 |
| Interquartile 75% (IQ3) | $75,942 | $104,418 |
| Interquartile Range (IQR) | $22,895 | $35,272 |
| Standard Deviation (Sample) | $18,137 | $29,812 |
| Standard Deviation (Population) | $18,021 | $29,471 |
Similar Demographics by Median Household Income
Demographics Similar to Spanish by Median Household Income
In terms of median household income, the demographic groups most similar to Spanish are Tsimshian ($83,346, a difference of 0.0%), German ($83,358, a difference of 0.020%), Immigrants from Thailand ($83,327, a difference of 0.020%), Immigrants from Cambodia ($83,304, a difference of 0.050%), and Japanese ($83,395, a difference of 0.060%).
| Demographics | Rating | Rank | Median Household Income |
| Ghanaians | 27.4 /100 | #194 | Fair $83,582 |
| Immigrants | Armenia | 27.0 /100 | #195 | Fair $83,555 |
| French | 26.0 /100 | #196 | Fair $83,468 |
| Aleuts | 25.7 /100 | #197 | Fair $83,446 |
| Japanese | 25.1 /100 | #198 | Fair $83,395 |
| Germans | 24.6 /100 | #199 | Fair $83,358 |
| Tsimshian | 24.5 /100 | #200 | Fair $83,346 |
| Spanish | 24.4 /100 | #201 | Fair $83,343 |
| Immigrants | Thailand | 24.3 /100 | #202 | Fair $83,327 |
| Immigrants | Cambodia | 24.0 /100 | #203 | Fair $83,304 |
| Immigrants | Africa | 23.8 /100 | #204 | Fair $83,289 |
| Celtics | 22.7 /100 | #205 | Fair $83,193 |
| Immigrants | Kenya | 21.3 /100 | #206 | Fair $83,068 |
| Dutch | 20.3 /100 | #207 | Fair $82,971 |
| French Canadians | 18.7 /100 | #208 | Poor $82,810 |
Demographics Similar to Immigrants from Zimbabwe by Median Household Income
In terms of median household income, the demographic groups most similar to Immigrants from Zimbabwe are Immigrants from Jordan ($89,412, a difference of 0.090%), Ethiopian ($89,640, a difference of 0.16%), Pakistani ($89,638, a difference of 0.16%), Immigrants from Kuwait ($89,263, a difference of 0.26%), and Immigrants from North Macedonia ($89,741, a difference of 0.27%).
| Demographics | Rating | Rank | Median Household Income |
| Native Hawaiians | 95.7 /100 | #116 | Exceptional $89,919 |
| Taiwanese | 95.6 /100 | #117 | Exceptional $89,900 |
| Syrians | 95.4 /100 | #118 | Exceptional $89,830 |
| Albanians | 95.2 /100 | #119 | Exceptional $89,744 |
| Immigrants | North Macedonia | 95.2 /100 | #120 | Exceptional $89,741 |
| Ethiopians | 94.9 /100 | #121 | Exceptional $89,640 |
| Pakistanis | 94.8 /100 | #122 | Exceptional $89,638 |
| Immigrants | Zimbabwe | 94.4 /100 | #123 | Exceptional $89,496 |
| Immigrants | Jordan | 94.1 /100 | #124 | Exceptional $89,412 |
| Immigrants | Kuwait | 93.5 /100 | #125 | Exceptional $89,263 |
| Immigrants | Oceania | 92.9 /100 | #126 | Exceptional $89,100 |
| Immigrants | Peru | 92.5 /100 | #127 | Exceptional $89,010 |
| Portuguese | 92.3 /100 | #128 | Exceptional $88,976 |
| Brazilians | 92.1 /100 | #129 | Exceptional $88,934 |
| British | 92.0 /100 | #130 | Exceptional $88,914 |