Creek vs Immigrants from Zaire Median Household Income
COMPARE
Creek
Immigrants from Zaire
Median Household Income
Median Household Income Comparison
Creek
Immigrants from Zaire
$67,715
MEDIAN HOUSEHOLD INCOME
0.0/ 100
METRIC RATING
333rd/ 347
METRIC RANK
$71,801
MEDIAN HOUSEHOLD INCOME
0.0/ 100
METRIC RATING
311th/ 347
METRIC RANK
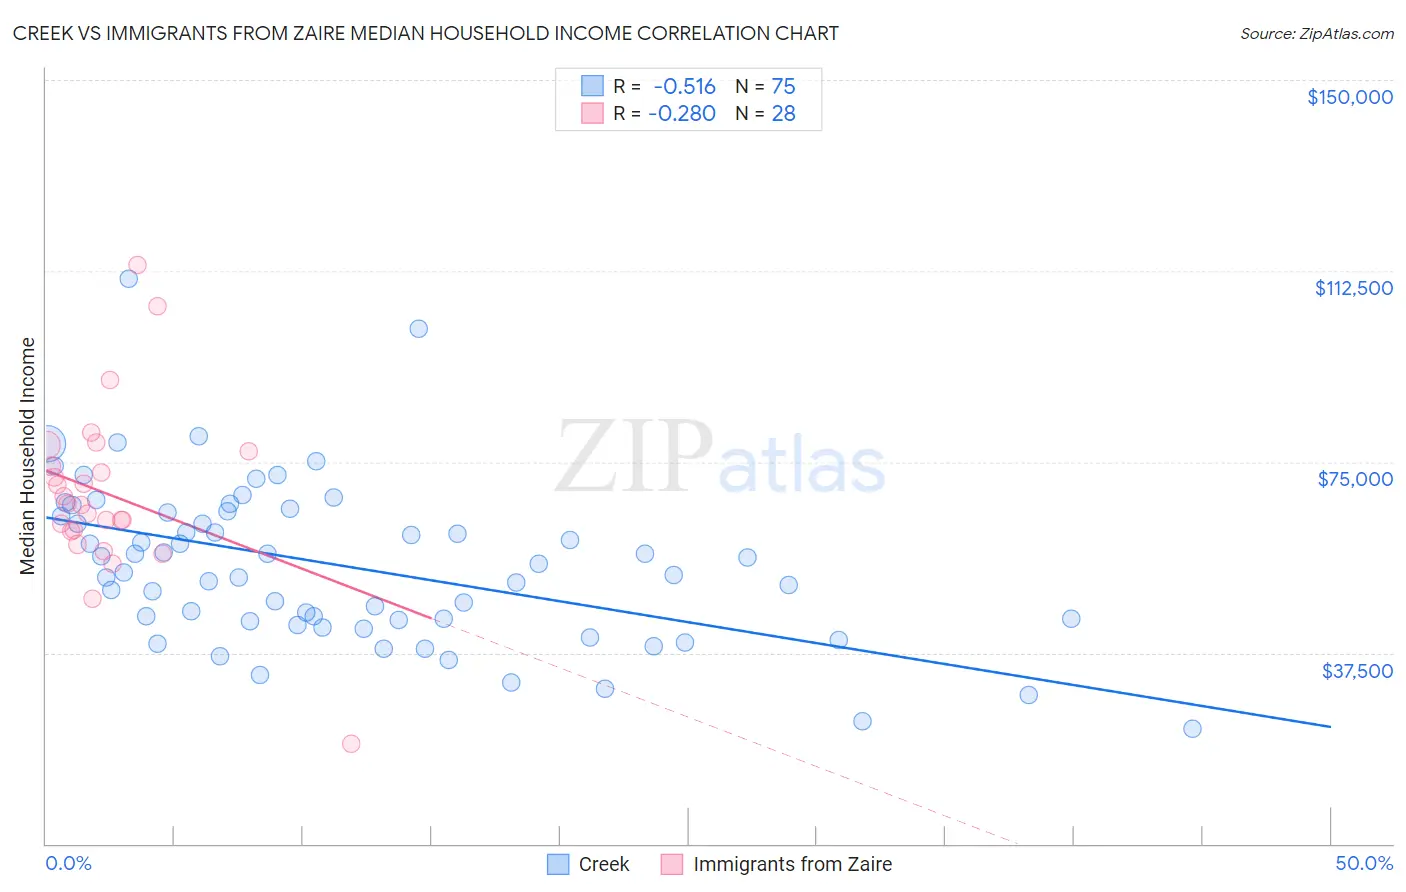
Creek vs Immigrants from Zaire Median Household Income Correlation Chart
The statistical analysis conducted on geographies consisting of 178,405,677 people shows a substantial negative correlation between the proportion of Creek and median household income in the United States with a correlation coefficient (R) of -0.516 and weighted average of $67,715. Similarly, the statistical analysis conducted on geographies consisting of 107,241,682 people shows a weak negative correlation between the proportion of Immigrants from Zaire and median household income in the United States with a correlation coefficient (R) of -0.280 and weighted average of $71,801, a difference of 6.0%.
Median Household Income Correlation Summary
| Measurement | Creek | Immigrants from Zaire |
| Minimum | $22,500 | $19,722 |
| Maximum | $111,063 | $113,664 |
| Range | $88,563 | $93,942 |
| Mean | $54,543 | $68,739 |
| Median | $53,166 | $66,729 |
| Interquartile 25% (IQ1) | $43,621 | $61,417 |
| Interquartile 75% (IQ3) | $65,130 | $75,692 |
| Interquartile Range (IQR) | $21,509 | $14,275 |
| Standard Deviation (Sample) | $15,915 | $17,188 |
| Standard Deviation (Population) | $15,809 | $16,878 |
Similar Demographics by Median Household Income
Demographics Similar to Creek by Median Household Income
In terms of median household income, the demographic groups most similar to Creek are Sioux ($67,792, a difference of 0.11%), Black/African American ($67,573, a difference of 0.21%), Native/Alaskan ($67,879, a difference of 0.24%), Arapaho ($67,965, a difference of 0.37%), and Dutch West Indian ($68,412, a difference of 1.0%).
| Demographics | Rating | Rank | Median Household Income |
| Yuman | 0.0 /100 | #326 | Tragic $68,743 |
| Immigrants | Cuba | 0.0 /100 | #327 | Tragic $68,461 |
| Menominee | 0.0 /100 | #328 | Tragic $68,423 |
| Dutch West Indians | 0.0 /100 | #329 | Tragic $68,412 |
| Arapaho | 0.0 /100 | #330 | Tragic $67,965 |
| Natives/Alaskans | 0.0 /100 | #331 | Tragic $67,879 |
| Sioux | 0.0 /100 | #332 | Tragic $67,792 |
| Creek | 0.0 /100 | #333 | Tragic $67,715 |
| Blacks/African Americans | 0.0 /100 | #334 | Tragic $67,573 |
| Cheyenne | 0.0 /100 | #335 | Tragic $66,974 |
| Immigrants | Congo | 0.0 /100 | #336 | Tragic $66,768 |
| Kiowa | 0.0 /100 | #337 | Tragic $65,914 |
| Immigrants | Yemen | 0.0 /100 | #338 | Tragic $65,194 |
| Hopi | 0.0 /100 | #339 | Tragic $65,043 |
| Pueblo | 0.0 /100 | #340 | Tragic $64,692 |
Demographics Similar to Immigrants from Zaire by Median Household Income
In terms of median household income, the demographic groups most similar to Immigrants from Zaire are U.S. Virgin Islander ($71,853, a difference of 0.070%), Immigrants from Caribbean ($71,860, a difference of 0.080%), Immigrants from Honduras ($71,452, a difference of 0.49%), Yakama ($72,225, a difference of 0.59%), and Immigrants from Bahamas ($71,349, a difference of 0.63%).
| Demographics | Rating | Rank | Median Household Income |
| Immigrants | Haiti | 0.0 /100 | #304 | Tragic $72,599 |
| Hondurans | 0.0 /100 | #305 | Tragic $72,588 |
| Potawatomi | 0.0 /100 | #306 | Tragic $72,576 |
| Ute | 0.0 /100 | #307 | Tragic $72,402 |
| Yakama | 0.0 /100 | #308 | Tragic $72,225 |
| Immigrants | Caribbean | 0.0 /100 | #309 | Tragic $71,860 |
| U.S. Virgin Islanders | 0.0 /100 | #310 | Tragic $71,853 |
| Immigrants | Zaire | 0.0 /100 | #311 | Tragic $71,801 |
| Immigrants | Honduras | 0.0 /100 | #312 | Tragic $71,452 |
| Immigrants | Bahamas | 0.0 /100 | #313 | Tragic $71,349 |
| Dominicans | 0.0 /100 | #314 | Tragic $71,302 |
| Ottawa | 0.0 /100 | #315 | Tragic $70,984 |
| Apache | 0.0 /100 | #316 | Tragic $70,927 |
| Cajuns | 0.0 /100 | #317 | Tragic $70,605 |
| Chippewa | 0.0 /100 | #318 | Tragic $70,539 |