Creek vs Immigrants from Ethiopia Median Household Income
COMPARE
Creek
Immigrants from Ethiopia
Median Household Income
Median Household Income Comparison
Creek
Immigrants from Ethiopia
$67,715
MEDIAN HOUSEHOLD INCOME
0.0/ 100
METRIC RATING
333rd/ 347
METRIC RANK
$88,687
MEDIAN HOUSEHOLD INCOME
90.9/ 100
METRIC RATING
133rd/ 347
METRIC RANK
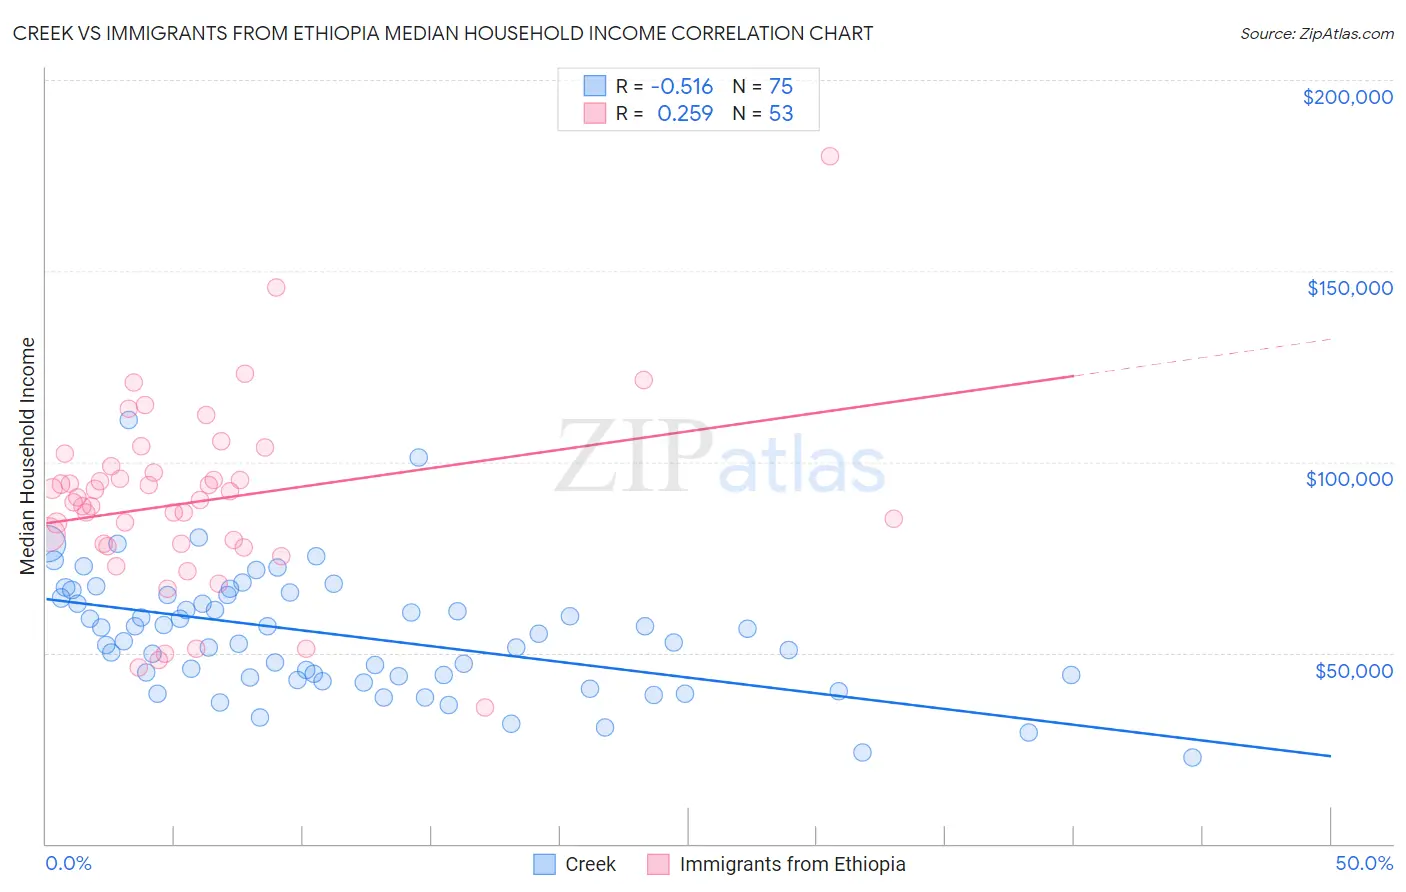
Creek vs Immigrants from Ethiopia Median Household Income Correlation Chart
The statistical analysis conducted on geographies consisting of 178,405,677 people shows a substantial negative correlation between the proportion of Creek and median household income in the United States with a correlation coefficient (R) of -0.516 and weighted average of $67,715. Similarly, the statistical analysis conducted on geographies consisting of 211,436,017 people shows a weak positive correlation between the proportion of Immigrants from Ethiopia and median household income in the United States with a correlation coefficient (R) of 0.259 and weighted average of $88,687, a difference of 31.0%.
Median Household Income Correlation Summary
| Measurement | Creek | Immigrants from Ethiopia |
| Minimum | $22,500 | $35,809 |
| Maximum | $111,063 | $180,167 |
| Range | $88,563 | $144,358 |
| Mean | $54,543 | $89,607 |
| Median | $53,166 | $90,025 |
| Interquartile 25% (IQ1) | $43,621 | $78,327 |
| Interquartile 75% (IQ3) | $65,130 | $98,118 |
| Interquartile Range (IQR) | $21,509 | $19,791 |
| Standard Deviation (Sample) | $15,915 | $24,432 |
| Standard Deviation (Population) | $15,809 | $24,200 |
Similar Demographics by Median Household Income
Demographics Similar to Creek by Median Household Income
In terms of median household income, the demographic groups most similar to Creek are Sioux ($67,792, a difference of 0.11%), Black/African American ($67,573, a difference of 0.21%), Native/Alaskan ($67,879, a difference of 0.24%), Arapaho ($67,965, a difference of 0.37%), and Dutch West Indian ($68,412, a difference of 1.0%).
| Demographics | Rating | Rank | Median Household Income |
| Yuman | 0.0 /100 | #326 | Tragic $68,743 |
| Immigrants | Cuba | 0.0 /100 | #327 | Tragic $68,461 |
| Menominee | 0.0 /100 | #328 | Tragic $68,423 |
| Dutch West Indians | 0.0 /100 | #329 | Tragic $68,412 |
| Arapaho | 0.0 /100 | #330 | Tragic $67,965 |
| Natives/Alaskans | 0.0 /100 | #331 | Tragic $67,879 |
| Sioux | 0.0 /100 | #332 | Tragic $67,792 |
| Creek | 0.0 /100 | #333 | Tragic $67,715 |
| Blacks/African Americans | 0.0 /100 | #334 | Tragic $67,573 |
| Cheyenne | 0.0 /100 | #335 | Tragic $66,974 |
| Immigrants | Congo | 0.0 /100 | #336 | Tragic $66,768 |
| Kiowa | 0.0 /100 | #337 | Tragic $65,914 |
| Immigrants | Yemen | 0.0 /100 | #338 | Tragic $65,194 |
| Hopi | 0.0 /100 | #339 | Tragic $65,043 |
| Pueblo | 0.0 /100 | #340 | Tragic $64,692 |
Demographics Similar to Immigrants from Ethiopia by Median Household Income
In terms of median household income, the demographic groups most similar to Immigrants from Ethiopia are European ($88,751, a difference of 0.070%), Immigrants from Syria ($88,792, a difference of 0.12%), Swedish ($88,524, a difference of 0.18%), Immigrants from Sierra Leone ($88,498, a difference of 0.21%), and Polish ($88,472, a difference of 0.24%).
| Demographics | Rating | Rank | Median Household Income |
| Immigrants | Oceania | 92.9 /100 | #126 | Exceptional $89,100 |
| Immigrants | Peru | 92.5 /100 | #127 | Exceptional $89,010 |
| Portuguese | 92.3 /100 | #128 | Exceptional $88,976 |
| Brazilians | 92.1 /100 | #129 | Exceptional $88,934 |
| British | 92.0 /100 | #130 | Exceptional $88,914 |
| Immigrants | Syria | 91.4 /100 | #131 | Exceptional $88,792 |
| Europeans | 91.2 /100 | #132 | Exceptional $88,751 |
| Immigrants | Ethiopia | 90.9 /100 | #133 | Exceptional $88,687 |
| Swedes | 90.0 /100 | #134 | Exceptional $88,524 |
| Immigrants | Sierra Leone | 89.9 /100 | #135 | Excellent $88,498 |
| Poles | 89.7 /100 | #136 | Excellent $88,472 |
| Sierra Leoneans | 89.6 /100 | #137 | Excellent $88,463 |
| Arabs | 89.2 /100 | #138 | Excellent $88,398 |
| Immigrants | Chile | 89.2 /100 | #139 | Excellent $88,388 |
| Lebanese | 87.2 /100 | #140 | Excellent $88,091 |