Creek vs Immigrants from Cambodia Per Capita Income
COMPARE
Creek
Immigrants from Cambodia
Per Capita Income
Per Capita Income Comparison
Creek
Immigrants from Cambodia
$35,546
PER CAPITA INCOME
0.0/ 100
METRIC RATING
322nd/ 347
METRIC RANK
$40,434
PER CAPITA INCOME
2.6/ 100
METRIC RATING
237th/ 347
METRIC RANK
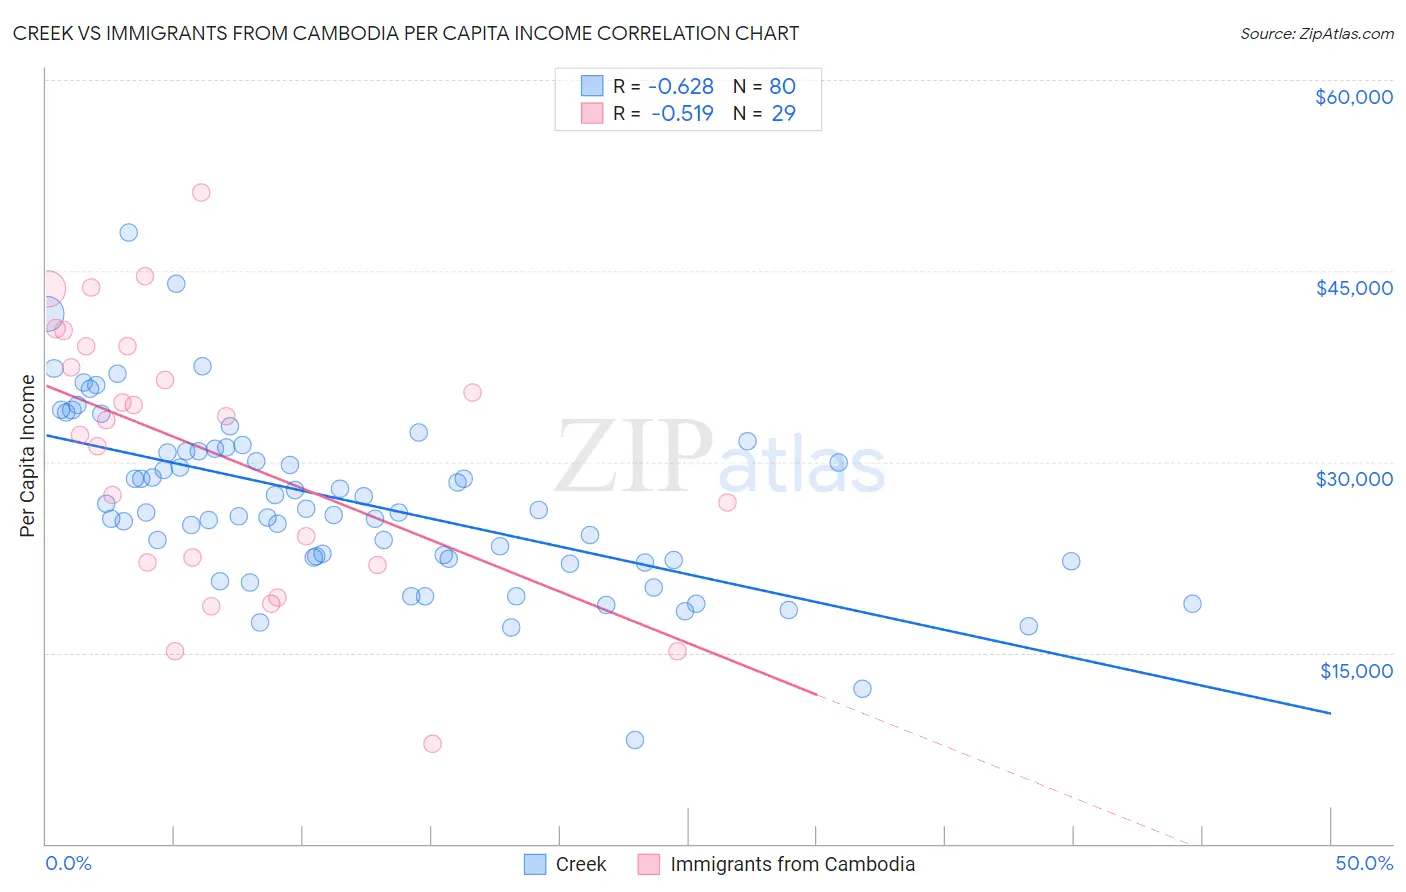
Creek vs Immigrants from Cambodia Per Capita Income Correlation Chart
The statistical analysis conducted on geographies consisting of 178,484,884 people shows a significant negative correlation between the proportion of Creek and per capita income in the United States with a correlation coefficient (R) of -0.628 and weighted average of $35,546. Similarly, the statistical analysis conducted on geographies consisting of 205,159,034 people shows a substantial negative correlation between the proportion of Immigrants from Cambodia and per capita income in the United States with a correlation coefficient (R) of -0.519 and weighted average of $40,434, a difference of 13.8%.
Per Capita Income Correlation Summary
| Measurement | Creek | Immigrants from Cambodia |
| Minimum | $8,185 | $7,849 |
| Maximum | $48,038 | $51,157 |
| Range | $39,853 | $43,308 |
| Mean | $26,882 | $30,701 |
| Median | $26,137 | $33,314 |
| Interquartile 25% (IQ1) | $22,339 | $21,996 |
| Interquartile 75% (IQ3) | $30,941 | $39,085 |
| Interquartile Range (IQR) | $8,603 | $17,089 |
| Standard Deviation (Sample) | $6,895 | $10,577 |
| Standard Deviation (Population) | $6,852 | $10,393 |
Similar Demographics by Per Capita Income
Demographics Similar to Creek by Per Capita Income
In terms of per capita income, the demographic groups most similar to Creek are Black/African American ($35,564, a difference of 0.050%), Hispanic or Latino ($35,688, a difference of 0.40%), Immigrants from Congo ($35,720, a difference of 0.49%), Cheyenne ($35,276, a difference of 0.76%), and Bangladeshi ($35,897, a difference of 0.99%).
| Demographics | Rating | Rank | Per Capita Income |
| Yaqui | 0.0 /100 | #315 | Tragic $36,112 |
| Choctaw | 0.0 /100 | #316 | Tragic $35,999 |
| Dutch West Indians | 0.0 /100 | #317 | Tragic $35,922 |
| Bangladeshis | 0.0 /100 | #318 | Tragic $35,897 |
| Immigrants | Congo | 0.0 /100 | #319 | Tragic $35,720 |
| Hispanics or Latinos | 0.0 /100 | #320 | Tragic $35,688 |
| Blacks/African Americans | 0.0 /100 | #321 | Tragic $35,564 |
| Creek | 0.0 /100 | #322 | Tragic $35,546 |
| Cheyenne | 0.0 /100 | #323 | Tragic $35,276 |
| Kiowa | 0.0 /100 | #324 | Tragic $35,102 |
| Immigrants | Central America | 0.0 /100 | #325 | Tragic $34,974 |
| Immigrants | Cuba | 0.0 /100 | #326 | Tragic $34,910 |
| Apache | 0.0 /100 | #327 | Tragic $34,886 |
| Menominee | 0.0 /100 | #328 | Tragic $34,578 |
| Mexicans | 0.0 /100 | #329 | Tragic $34,559 |
Demographics Similar to Immigrants from Cambodia by Per Capita Income
In terms of per capita income, the demographic groups most similar to Immigrants from Cambodia are Somali ($40,367, a difference of 0.16%), Tsimshian ($40,344, a difference of 0.22%), Immigrants from Nigeria ($40,339, a difference of 0.24%), British West Indian ($40,330, a difference of 0.26%), and Immigrants from Western Africa ($40,294, a difference of 0.35%).
| Demographics | Rating | Rank | Per Capita Income |
| Native Hawaiians | 4.9 /100 | #230 | Tragic $41,017 |
| Senegalese | 4.8 /100 | #231 | Tragic $41,000 |
| Guyanese | 4.5 /100 | #232 | Tragic $40,949 |
| Delaware | 3.8 /100 | #233 | Tragic $40,778 |
| Immigrants | West Indies | 3.7 /100 | #234 | Tragic $40,763 |
| Immigrants | Guyana | 3.6 /100 | #235 | Tragic $40,742 |
| Immigrants | Nonimmigrants | 3.4 /100 | #236 | Tragic $40,669 |
| Immigrants | Cambodia | 2.6 /100 | #237 | Tragic $40,434 |
| Somalis | 2.4 /100 | #238 | Tragic $40,367 |
| Tsimshian | 2.4 /100 | #239 | Tragic $40,344 |
| Immigrants | Nigeria | 2.3 /100 | #240 | Tragic $40,339 |
| British West Indians | 2.3 /100 | #241 | Tragic $40,330 |
| Immigrants | Western Africa | 2.2 /100 | #242 | Tragic $40,294 |
| German Russians | 2.2 /100 | #243 | Tragic $40,266 |
| French American Indians | 2.1 /100 | #244 | Tragic $40,244 |