Creek vs Immigrants from Kazakhstan Wage/Income Gap
COMPARE
Creek
Immigrants from Kazakhstan
Wage/Income Gap
Wage/Income Gap Comparison
Creek
Immigrants from Kazakhstan
27.1%
WAGE/INCOME GAP
3.8/ 100
METRIC RATING
241st/ 347
METRIC RANK
26.0%
WAGE/INCOME GAP
35.2/ 100
METRIC RATING
183rd/ 347
METRIC RANK
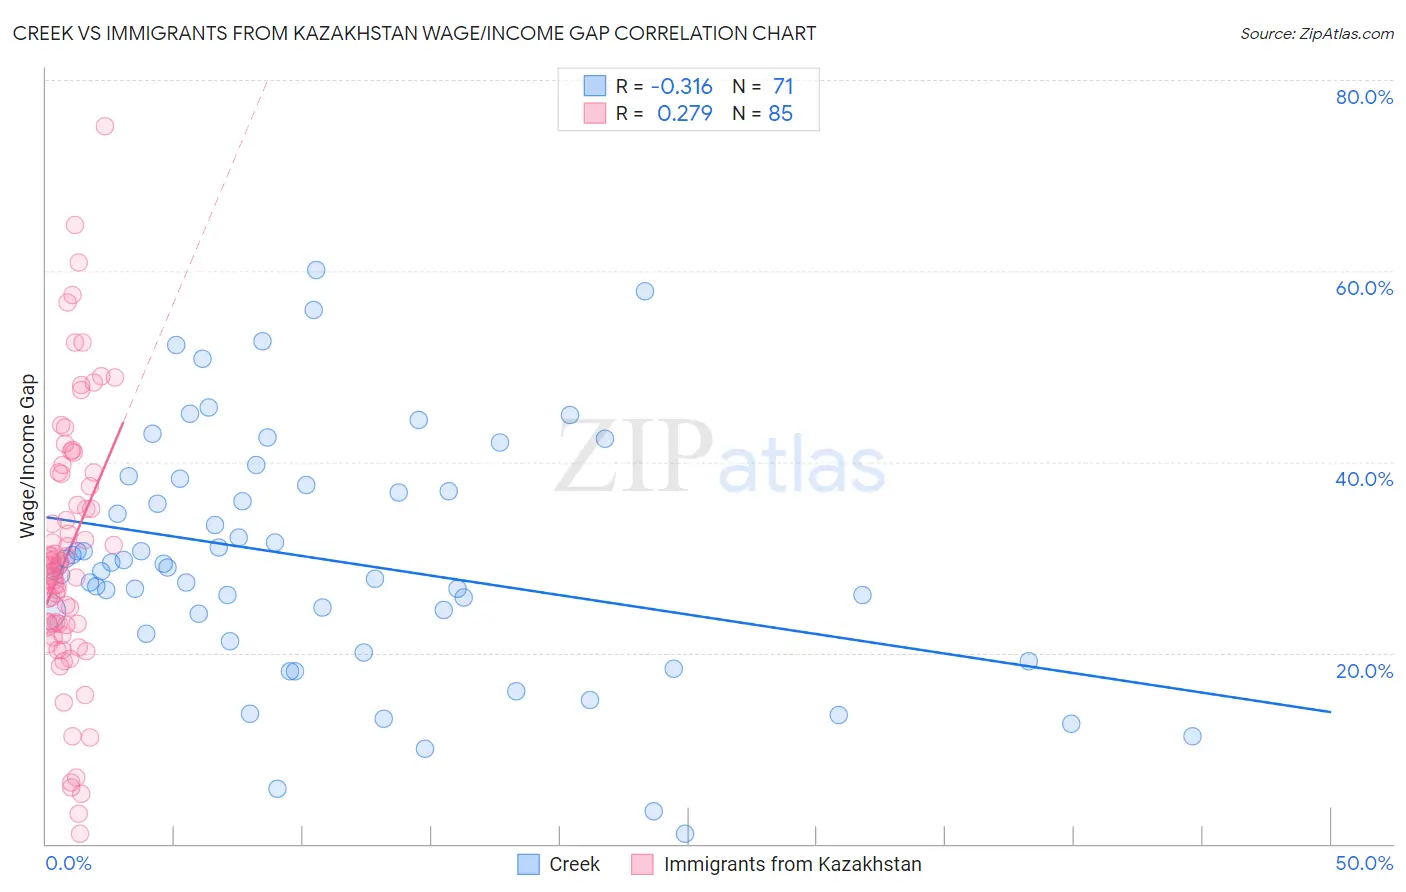
Creek vs Immigrants from Kazakhstan Wage/Income Gap Correlation Chart
The statistical analysis conducted on geographies consisting of 178,368,499 people shows a mild negative correlation between the proportion of Creek and wage/income gap percentage in the United States with a correlation coefficient (R) of -0.316 and weighted average of 27.1%. Similarly, the statistical analysis conducted on geographies consisting of 124,424,213 people shows a weak positive correlation between the proportion of Immigrants from Kazakhstan and wage/income gap percentage in the United States with a correlation coefficient (R) of 0.279 and weighted average of 26.0%, a difference of 4.2%.
Wage/Income Gap Correlation Summary
| Measurement | Creek | Immigrants from Kazakhstan |
| Minimum | 0.99% | 1.1% |
| Maximum | 60.1% | 75.1% |
| Range | 59.1% | 74.1% |
| Mean | 29.8% | 30.4% |
| Median | 28.9% | 29.1% |
| Interquartile 25% (IQ1) | 22.0% | 22.9% |
| Interquartile 75% (IQ3) | 37.6% | 38.8% |
| Interquartile Range (IQR) | 15.5% | 15.9% |
| Standard Deviation (Sample) | 12.7% | 13.9% |
| Standard Deviation (Population) | 12.6% | 13.8% |
Similar Demographics by Wage/Income Gap
Demographics Similar to Creek by Wage/Income Gap
In terms of wage/income gap, the demographic groups most similar to Creek are Immigrants from Europe (27.1%, a difference of 0.020%), Immigrants from Sri Lanka (27.1%, a difference of 0.050%), Spanish (27.1%, a difference of 0.060%), Chickasaw (27.2%, a difference of 0.13%), and Immigrants from the Azores (27.2%, a difference of 0.14%).
| Demographics | Rating | Rank | Wage/Income Gap |
| Immigrants | Pakistan | 4.9 /100 | #234 | Tragic 27.0% |
| Immigrants | Hungary | 4.8 /100 | #235 | Tragic 27.0% |
| Immigrants | Romania | 4.8 /100 | #236 | Tragic 27.0% |
| Immigrants | Eastern Asia | 4.4 /100 | #237 | Tragic 27.1% |
| Osage | 4.4 /100 | #238 | Tragic 27.1% |
| Estonians | 4.3 /100 | #239 | Tragic 27.1% |
| Immigrants | Europe | 3.8 /100 | #240 | Tragic 27.1% |
| Creek | 3.8 /100 | #241 | Tragic 27.1% |
| Immigrants | Sri Lanka | 3.7 /100 | #242 | Tragic 27.1% |
| Spanish | 3.6 /100 | #243 | Tragic 27.1% |
| Chickasaw | 3.5 /100 | #244 | Tragic 27.2% |
| Immigrants | Azores | 3.5 /100 | #245 | Tragic 27.2% |
| Immigrants | Nonimmigrants | 3.3 /100 | #246 | Tragic 27.2% |
| Celtics | 2.8 /100 | #247 | Tragic 27.3% |
| Cypriots | 2.8 /100 | #248 | Tragic 27.3% |
Demographics Similar to Immigrants from Kazakhstan by Wage/Income Gap
In terms of wage/income gap, the demographic groups most similar to Immigrants from Kazakhstan are Immigrants from Serbia (26.0%, a difference of 0.010%), Mexican (26.0%, a difference of 0.060%), Immigrants from Bolivia (26.0%, a difference of 0.090%), Pakistani (26.1%, a difference of 0.11%), and Immigrants from Indonesia (26.1%, a difference of 0.19%).
| Demographics | Rating | Rank | Wage/Income Gap |
| Paraguayans | 46.7 /100 | #176 | Average 25.8% |
| Cambodians | 45.1 /100 | #177 | Average 25.8% |
| Chinese | 42.0 /100 | #178 | Average 25.9% |
| Samoans | 38.6 /100 | #179 | Fair 26.0% |
| Guamanians/Chamorros | 38.0 /100 | #180 | Fair 26.0% |
| Immigrants | Bolivia | 36.4 /100 | #181 | Fair 26.0% |
| Immigrants | Serbia | 35.4 /100 | #182 | Fair 26.0% |
| Immigrants | Kazakhstan | 35.2 /100 | #183 | Fair 26.0% |
| Mexicans | 34.4 /100 | #184 | Fair 26.0% |
| Pakistanis | 33.7 /100 | #185 | Fair 26.1% |
| Immigrants | Indonesia | 32.5 /100 | #186 | Fair 26.1% |
| Palestinians | 29.9 /100 | #187 | Fair 26.1% |
| Immigrants | Egypt | 29.9 /100 | #188 | Fair 26.1% |
| Immigrants | Moldova | 26.6 /100 | #189 | Fair 26.2% |
| Immigrants | Croatia | 24.8 /100 | #190 | Fair 26.2% |