Turkish vs Immigrants from Kazakhstan Wage/Income Gap
COMPARE
Turkish
Immigrants from Kazakhstan
Wage/Income Gap
Wage/Income Gap Comparison
Turks
Immigrants from Kazakhstan
27.7%
WAGE/INCOME GAP
1.0/ 100
METRIC RATING
267th/ 347
METRIC RANK
26.0%
WAGE/INCOME GAP
35.2/ 100
METRIC RATING
183rd/ 347
METRIC RANK
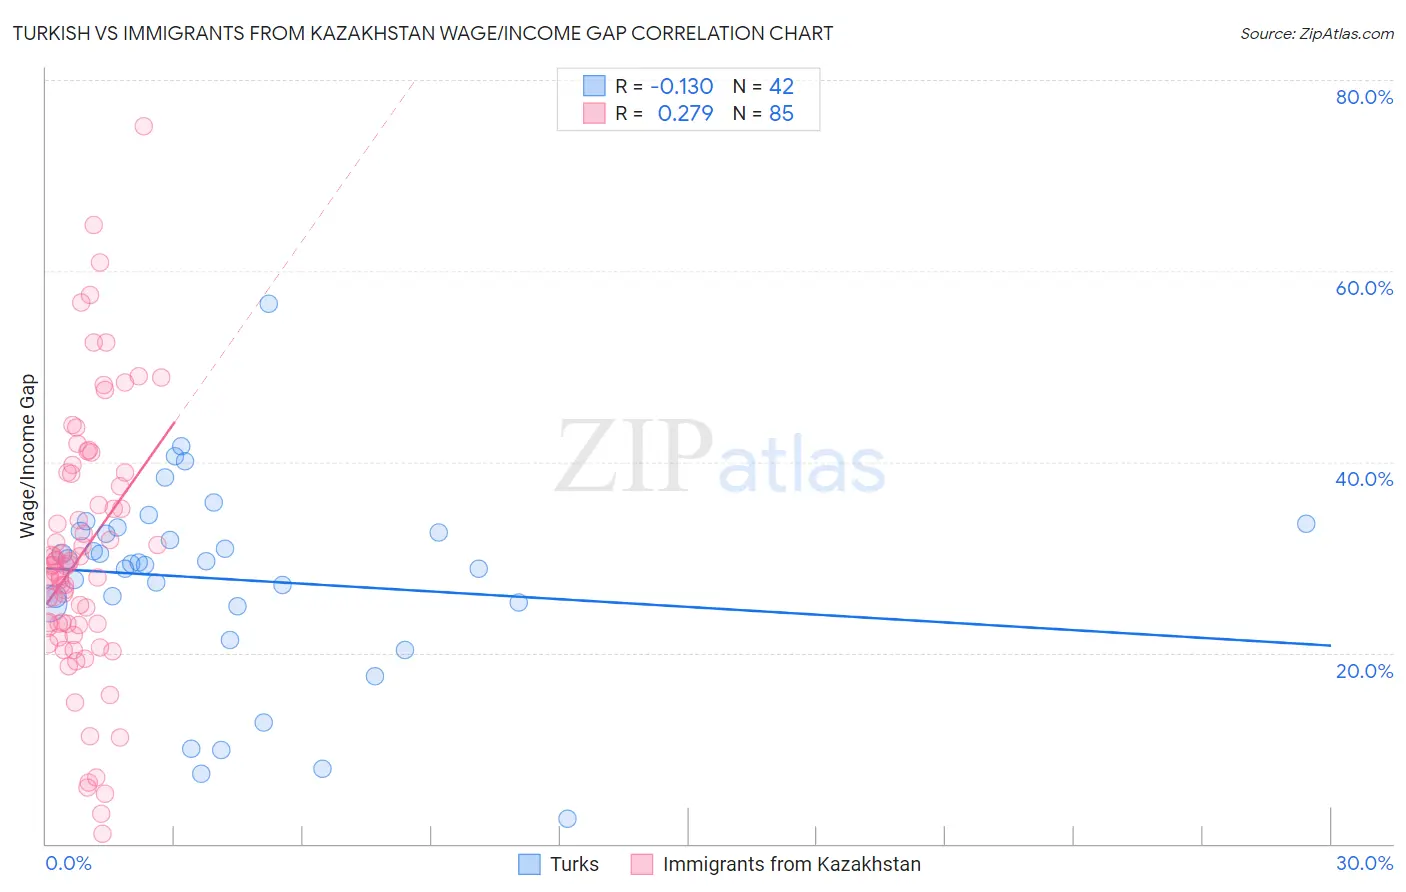
Turkish vs Immigrants from Kazakhstan Wage/Income Gap Correlation Chart
The statistical analysis conducted on geographies consisting of 271,781,198 people shows a poor negative correlation between the proportion of Turks and wage/income gap percentage in the United States with a correlation coefficient (R) of -0.130 and weighted average of 27.7%. Similarly, the statistical analysis conducted on geographies consisting of 124,424,213 people shows a weak positive correlation between the proportion of Immigrants from Kazakhstan and wage/income gap percentage in the United States with a correlation coefficient (R) of 0.279 and weighted average of 26.0%, a difference of 6.4%.
Wage/Income Gap Correlation Summary
| Measurement | Turkish | Immigrants from Kazakhstan |
| Minimum | 2.6% | 1.1% |
| Maximum | 56.6% | 75.1% |
| Range | 54.0% | 74.1% |
| Mean | 27.7% | 30.4% |
| Median | 29.3% | 29.1% |
| Interquartile 25% (IQ1) | 25.1% | 22.9% |
| Interquartile 75% (IQ3) | 32.7% | 38.8% |
| Interquartile Range (IQR) | 7.6% | 15.9% |
| Standard Deviation (Sample) | 10.3% | 13.9% |
| Standard Deviation (Population) | 10.2% | 13.8% |
Similar Demographics by Wage/Income Gap
Demographics Similar to Turks by Wage/Income Gap
In terms of wage/income gap, the demographic groups most similar to Turks are Immigrants from Switzerland (27.7%, a difference of 0.020%), Serbian (27.7%, a difference of 0.020%), Hmong (27.7%, a difference of 0.020%), New Zealander (27.7%, a difference of 0.080%), and Potawatomi (27.7%, a difference of 0.090%).
| Demographics | Rating | Rank | Wage/Income Gap |
| Tongans | 1.7 /100 | #260 | Tragic 27.5% |
| Immigrants | Germany | 1.5 /100 | #261 | Tragic 27.5% |
| Immigrants | Lebanon | 1.5 /100 | #262 | Tragic 27.5% |
| Syrians | 1.4 /100 | #263 | Tragic 27.6% |
| Immigrants | Switzerland | 1.0 /100 | #264 | Tragic 27.7% |
| Serbians | 1.0 /100 | #265 | Tragic 27.7% |
| Hmong | 1.0 /100 | #266 | Tragic 27.7% |
| Turks | 1.0 /100 | #267 | Tragic 27.7% |
| New Zealanders | 1.0 /100 | #268 | Tragic 27.7% |
| Potawatomi | 0.9 /100 | #269 | Tragic 27.7% |
| Immigrants | Western Europe | 0.9 /100 | #270 | Tragic 27.8% |
| Ute | 0.8 /100 | #271 | Tragic 27.8% |
| Immigrants | Korea | 0.8 /100 | #272 | Tragic 27.8% |
| Bulgarians | 0.7 /100 | #273 | Tragic 27.8% |
| Americans | 0.7 /100 | #274 | Tragic 27.8% |
Demographics Similar to Immigrants from Kazakhstan by Wage/Income Gap
In terms of wage/income gap, the demographic groups most similar to Immigrants from Kazakhstan are Immigrants from Serbia (26.0%, a difference of 0.010%), Mexican (26.0%, a difference of 0.060%), Immigrants from Bolivia (26.0%, a difference of 0.090%), Pakistani (26.1%, a difference of 0.11%), and Immigrants from Indonesia (26.1%, a difference of 0.19%).
| Demographics | Rating | Rank | Wage/Income Gap |
| Paraguayans | 46.7 /100 | #176 | Average 25.8% |
| Cambodians | 45.1 /100 | #177 | Average 25.8% |
| Chinese | 42.0 /100 | #178 | Average 25.9% |
| Samoans | 38.6 /100 | #179 | Fair 26.0% |
| Guamanians/Chamorros | 38.0 /100 | #180 | Fair 26.0% |
| Immigrants | Bolivia | 36.4 /100 | #181 | Fair 26.0% |
| Immigrants | Serbia | 35.4 /100 | #182 | Fair 26.0% |
| Immigrants | Kazakhstan | 35.2 /100 | #183 | Fair 26.0% |
| Mexicans | 34.4 /100 | #184 | Fair 26.0% |
| Pakistanis | 33.7 /100 | #185 | Fair 26.1% |
| Immigrants | Indonesia | 32.5 /100 | #186 | Fair 26.1% |
| Palestinians | 29.9 /100 | #187 | Fair 26.1% |
| Immigrants | Egypt | 29.9 /100 | #188 | Fair 26.1% |
| Immigrants | Moldova | 26.6 /100 | #189 | Fair 26.2% |
| Immigrants | Croatia | 24.8 /100 | #190 | Fair 26.2% |