Cree vs Immigrants from Syria Unemployment Among Seniors over 65 years
COMPARE
Cree
Immigrants from Syria
Unemployment Among Seniors over 65 years
Unemployment Among Seniors over 65 years Comparison
Cree
Immigrants from Syria
5.3%
UNEMPLOYMENT AMONG SENIORS OVER 65 YEARS
5.8/ 100
METRIC RATING
223rd/ 347
METRIC RANK
5.3%
UNEMPLOYMENT AMONG SENIORS OVER 65 YEARS
5.6/ 100
METRIC RATING
224th/ 347
METRIC RANK
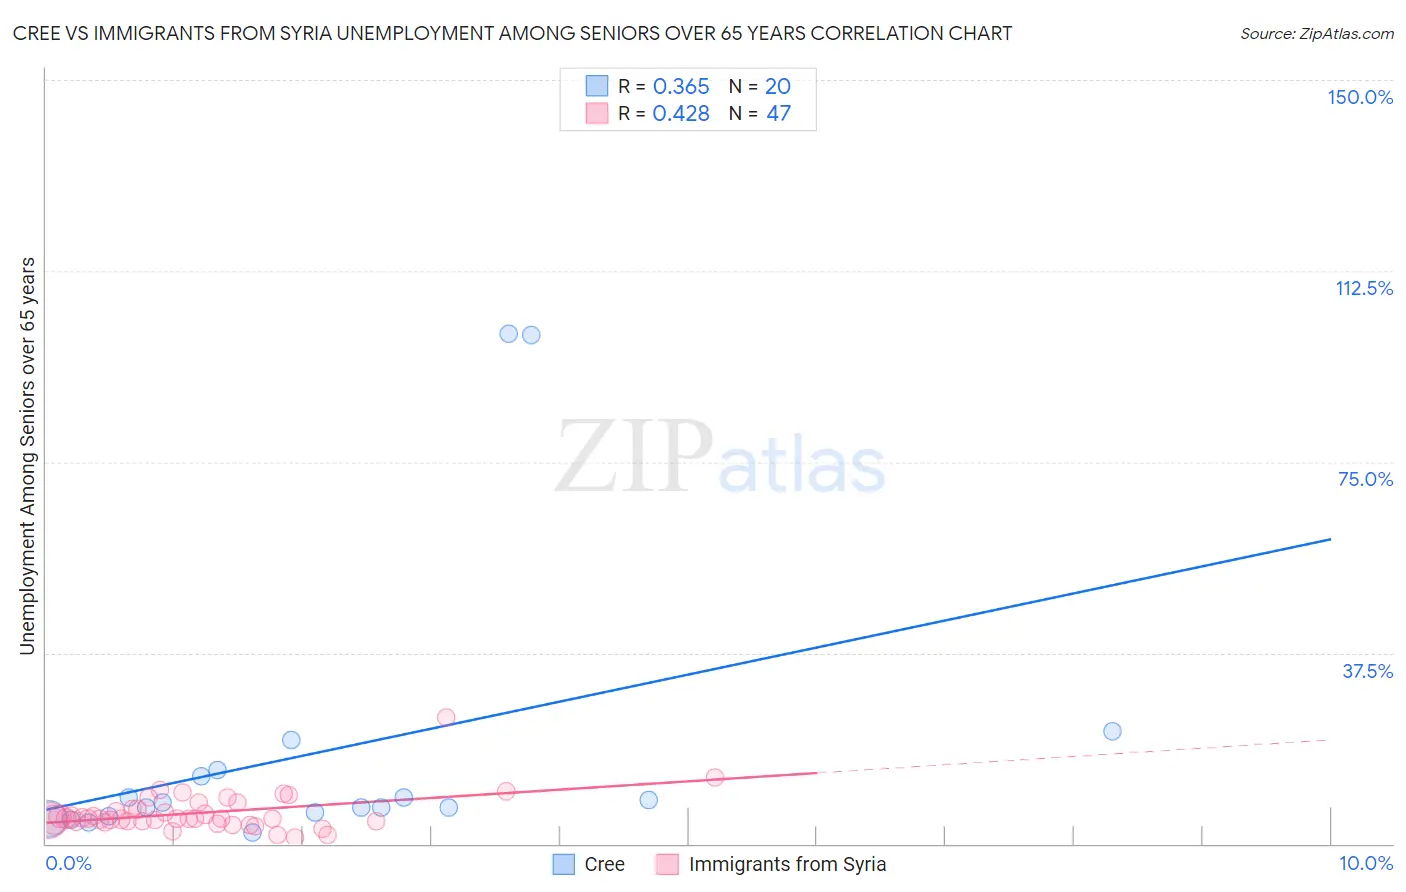
Cree vs Immigrants from Syria Unemployment Among Seniors over 65 years Correlation Chart
The statistical analysis conducted on geographies consisting of 73,743,775 people shows a mild positive correlation between the proportion of Cree and unemployment rate amomg seniors over the age of 65 in the United States with a correlation coefficient (R) of 0.365 and weighted average of 5.3%. Similarly, the statistical analysis conducted on geographies consisting of 167,873,990 people shows a moderate positive correlation between the proportion of Immigrants from Syria and unemployment rate amomg seniors over the age of 65 in the United States with a correlation coefficient (R) of 0.428 and weighted average of 5.3%, a difference of 0.020%.
Unemployment Among Seniors over 65 years Correlation Summary
| Measurement | Cree | Immigrants from Syria |
| Minimum | 2.3% | 1.3% |
| Maximum | 100.1% | 24.8% |
| Range | 97.8% | 23.5% |
| Mean | 18.1% | 6.1% |
| Median | 7.7% | 4.9% |
| Interquartile 25% (IQ1) | 5.8% | 4.5% |
| Interquartile 75% (IQ3) | 13.8% | 6.9% |
| Interquartile Range (IQR) | 8.0% | 2.4% |
| Standard Deviation (Sample) | 28.5% | 3.8% |
| Standard Deviation (Population) | 27.8% | 3.7% |
Demographics Similar to Cree and Immigrants from Syria by Unemployment Among Seniors over 65 years
In terms of unemployment among seniors over 65 years, the demographic groups most similar to Cree are Honduran (5.3%, a difference of 0.030%), Israeli (5.3%, a difference of 0.060%), Immigrants from Croatia (5.3%, a difference of 0.070%), Arapaho (5.3%, a difference of 0.080%), and French American Indian (5.3%, a difference of 0.080%). Similarly, the demographic groups most similar to Immigrants from Syria are Honduran (5.3%, a difference of 0.010%), Immigrants from Croatia (5.3%, a difference of 0.050%), French American Indian (5.3%, a difference of 0.060%), Israeli (5.3%, a difference of 0.080%), and Egyptian (5.3%, a difference of 0.10%).
| Demographics | Rating | Rank | Unemployment Among Seniors over 65 years |
| Immigrants | Uruguay | 9.3 /100 | #213 | Tragic 5.2% |
| Albanians | 9.1 /100 | #214 | Tragic 5.2% |
| Immigrants | Fiji | 8.6 /100 | #215 | Tragic 5.2% |
| Cajuns | 8.5 /100 | #216 | Tragic 5.2% |
| Italians | 8.3 /100 | #217 | Tragic 5.2% |
| Spaniards | 7.4 /100 | #218 | Tragic 5.2% |
| Dutch West Indians | 6.9 /100 | #219 | Tragic 5.3% |
| Egyptians | 6.4 /100 | #220 | Tragic 5.3% |
| Arapaho | 6.3 /100 | #221 | Tragic 5.3% |
| Israelis | 6.2 /100 | #222 | Tragic 5.3% |
| Cree | 5.8 /100 | #223 | Tragic 5.3% |
| Immigrants | Syria | 5.6 /100 | #224 | Tragic 5.3% |
| Hondurans | 5.6 /100 | #225 | Tragic 5.3% |
| Immigrants | Croatia | 5.3 /100 | #226 | Tragic 5.3% |
| French American Indians | 5.2 /100 | #227 | Tragic 5.3% |
| Haitians | 4.4 /100 | #228 | Tragic 5.3% |
| Samoans | 4.2 /100 | #229 | Tragic 5.3% |
| Immigrants | Argentina | 4.0 /100 | #230 | Tragic 5.3% |
| Hungarians | 3.9 /100 | #231 | Tragic 5.3% |
| Hopi | 3.5 /100 | #232 | Tragic 5.3% |
| Marshallese | 3.1 /100 | #233 | Tragic 5.3% |