Chinese vs Immigrants from Iran Per Capita Income
COMPARE
Chinese
Immigrants from Iran
Per Capita Income
Per Capita Income Comparison
Chinese
Immigrants from Iran
$46,098
PER CAPITA INCOME
93.9/ 100
METRIC RATING
117th/ 347
METRIC RANK
$57,759
PER CAPITA INCOME
100.0/ 100
METRIC RATING
5th/ 347
METRIC RANK
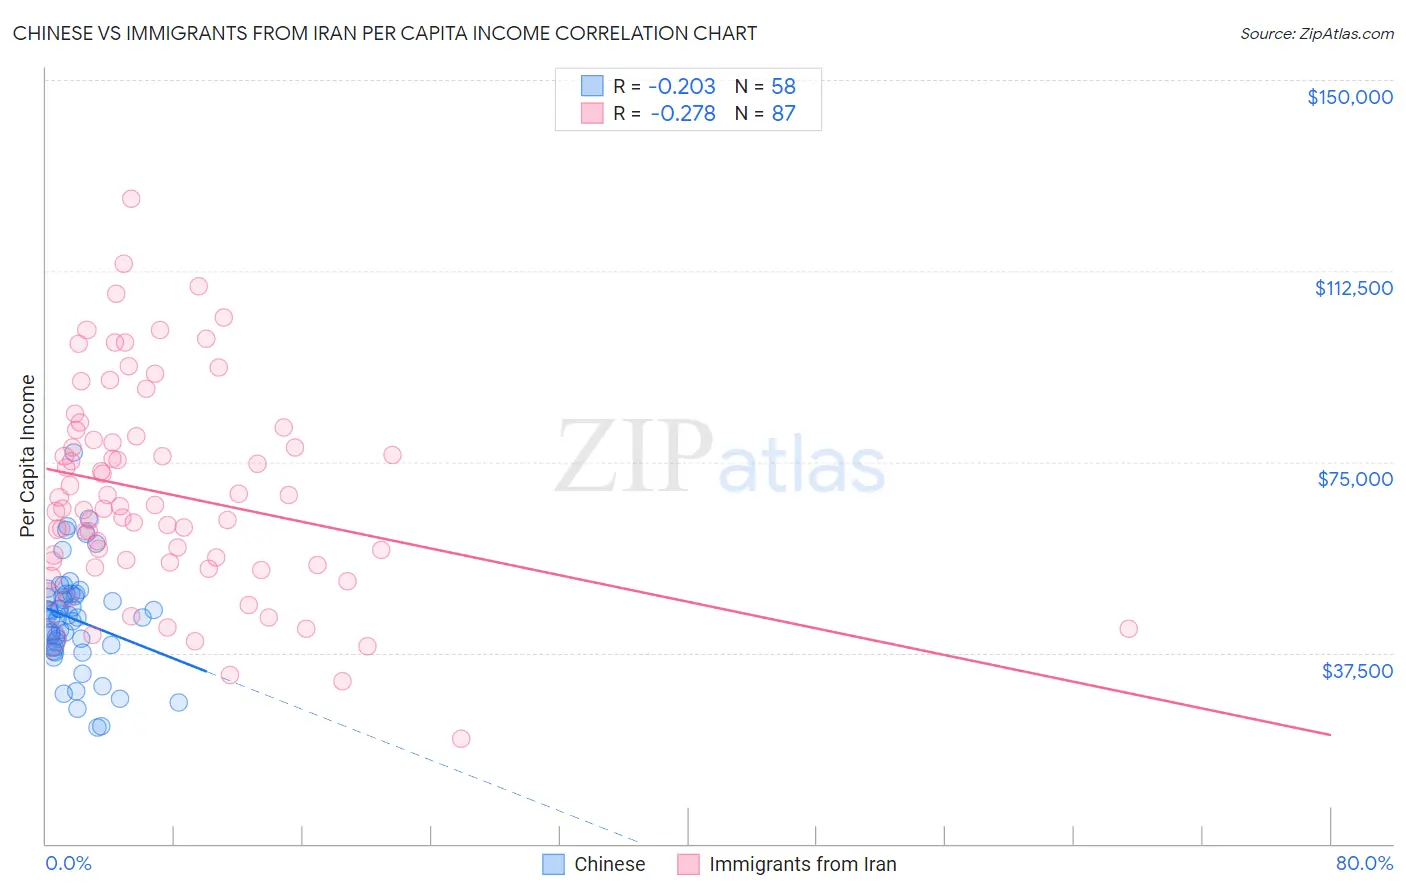
Chinese vs Immigrants from Iran Per Capita Income Correlation Chart
The statistical analysis conducted on geographies consisting of 64,809,125 people shows a weak negative correlation between the proportion of Chinese and per capita income in the United States with a correlation coefficient (R) of -0.203 and weighted average of $46,098. Similarly, the statistical analysis conducted on geographies consisting of 279,905,207 people shows a weak negative correlation between the proportion of Immigrants from Iran and per capita income in the United States with a correlation coefficient (R) of -0.278 and weighted average of $57,759, a difference of 25.3%.
Per Capita Income Correlation Summary
| Measurement | Chinese | Immigrants from Iran |
| Minimum | $22,765 | $20,655 |
| Maximum | $76,789 | $126,563 |
| Range | $54,024 | $105,908 |
| Mean | $44,105 | $68,785 |
| Median | $44,514 | $65,816 |
| Interquartile 25% (IQ1) | $38,432 | $55,345 |
| Interquartile 75% (IQ3) | $49,089 | $79,969 |
| Interquartile Range (IQR) | $10,657 | $24,624 |
| Standard Deviation (Sample) | $10,226 | $20,524 |
| Standard Deviation (Population) | $10,137 | $20,406 |
Similar Demographics by Per Capita Income
Demographics Similar to Chinese by Per Capita Income
In terms of per capita income, the demographic groups most similar to Chinese are Polish ($46,123, a difference of 0.050%), Immigrants from Saudi Arabia ($46,008, a difference of 0.19%), Immigrants from Chile ($46,213, a difference of 0.25%), Immigrants from Poland ($45,979, a difference of 0.26%), and Afghan ($46,268, a difference of 0.37%).
| Demographics | Rating | Rank | Per Capita Income |
| Chileans | 95.9 /100 | #110 | Exceptional $46,459 |
| Taiwanese | 95.8 /100 | #111 | Exceptional $46,455 |
| Immigrants | Morocco | 95.7 /100 | #112 | Exceptional $46,430 |
| Immigrants | Albania | 95.5 /100 | #113 | Exceptional $46,387 |
| Afghans | 94.9 /100 | #114 | Exceptional $46,268 |
| Immigrants | Chile | 94.6 /100 | #115 | Exceptional $46,213 |
| Poles | 94.1 /100 | #116 | Exceptional $46,123 |
| Chinese | 93.9 /100 | #117 | Exceptional $46,098 |
| Immigrants | Saudi Arabia | 93.3 /100 | #118 | Exceptional $46,008 |
| Immigrants | Poland | 93.1 /100 | #119 | Exceptional $45,979 |
| Immigrants | Ethiopia | 92.7 /100 | #120 | Exceptional $45,923 |
| Canadians | 92.2 /100 | #121 | Exceptional $45,858 |
| Moroccans | 92.1 /100 | #122 | Exceptional $45,854 |
| Lebanese | 92.0 /100 | #123 | Exceptional $45,840 |
| Europeans | 92.0 /100 | #124 | Exceptional $45,836 |
Demographics Similar to Immigrants from Iran by Per Capita Income
In terms of per capita income, the demographic groups most similar to Immigrants from Iran are Immigrants from Taiwan ($57,742, a difference of 0.030%), Immigrants from Australia ($57,953, a difference of 0.34%), Immigrants from Israel ($57,384, a difference of 0.65%), Immigrants from Singapore ($58,353, a difference of 1.0%), and Iranian ($58,786, a difference of 1.8%).
| Demographics | Rating | Rank | Per Capita Income |
| Filipinos | 100.0 /100 | #1 | Exceptional $59,066 |
| Iranians | 100.0 /100 | #2 | Exceptional $58,786 |
| Immigrants | Singapore | 100.0 /100 | #3 | Exceptional $58,353 |
| Immigrants | Australia | 100.0 /100 | #4 | Exceptional $57,953 |
| Immigrants | Iran | 100.0 /100 | #5 | Exceptional $57,759 |
| Immigrants | Taiwan | 100.0 /100 | #6 | Exceptional $57,742 |
| Immigrants | Israel | 100.0 /100 | #7 | Exceptional $57,384 |
| Immigrants | Hong Kong | 100.0 /100 | #8 | Exceptional $56,709 |
| Immigrants | Ireland | 100.0 /100 | #9 | Exceptional $56,584 |
| Okinawans | 100.0 /100 | #10 | Exceptional $55,817 |
| Eastern Europeans | 100.0 /100 | #11 | Exceptional $55,780 |
| Immigrants | Sweden | 100.0 /100 | #12 | Exceptional $55,582 |
| Immigrants | India | 100.0 /100 | #13 | Exceptional $55,268 |
| Immigrants | Belgium | 100.0 /100 | #14 | Exceptional $55,082 |
| Cypriots | 100.0 /100 | #15 | Exceptional $54,899 |