Chinese vs Immigrants from Syria Per Capita Income
COMPARE
Chinese
Immigrants from Syria
Per Capita Income
Per Capita Income Comparison
Chinese
Immigrants from Syria
$46,098
PER CAPITA INCOME
93.9/ 100
METRIC RATING
117th/ 347
METRIC RANK
$45,218
PER CAPITA INCOME
85.2/ 100
METRIC RATING
137th/ 347
METRIC RANK
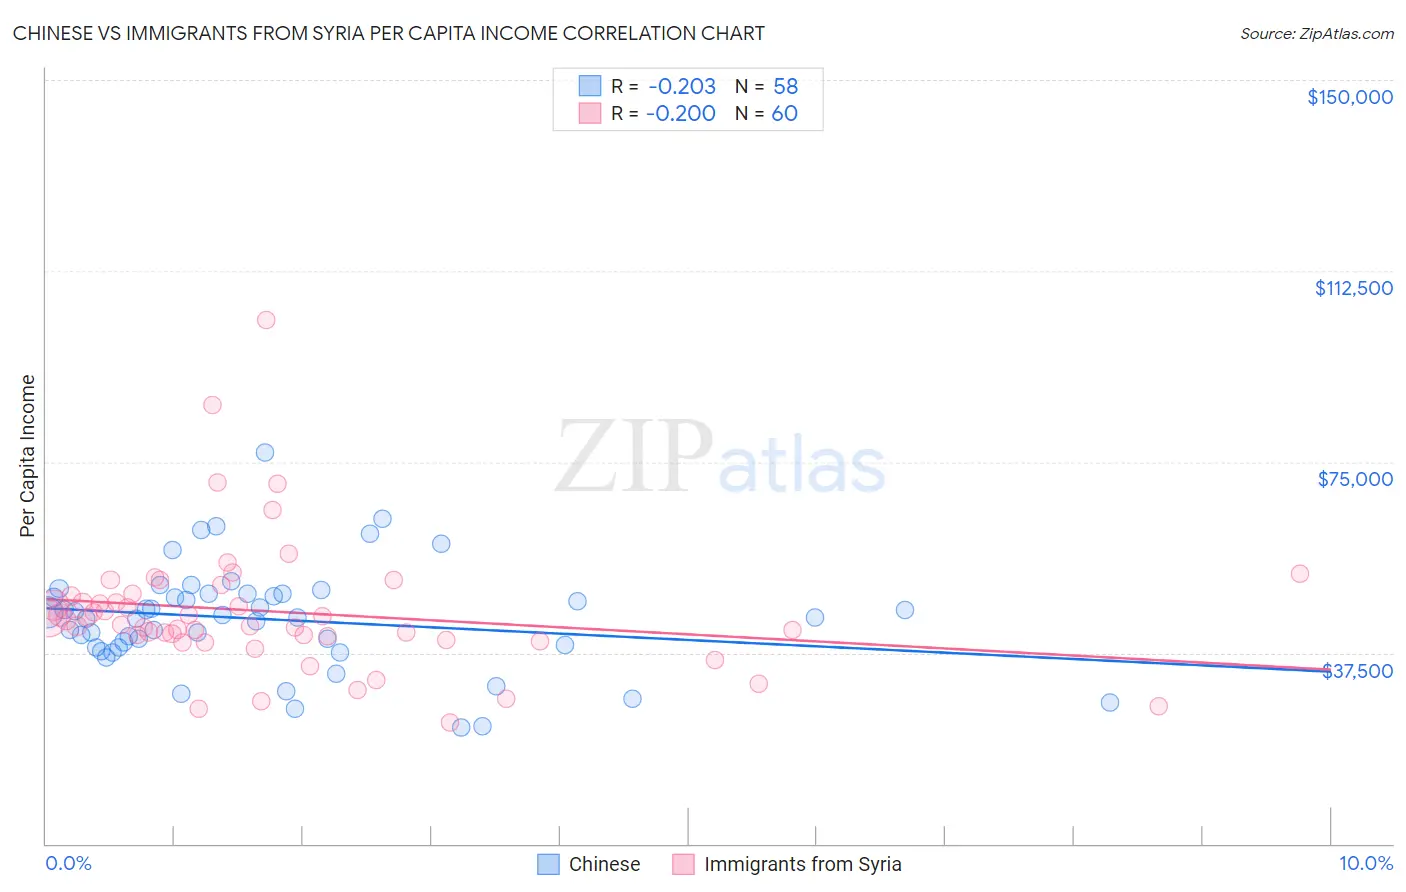
Chinese vs Immigrants from Syria Per Capita Income Correlation Chart
The statistical analysis conducted on geographies consisting of 64,809,125 people shows a weak negative correlation between the proportion of Chinese and per capita income in the United States with a correlation coefficient (R) of -0.203 and weighted average of $46,098. Similarly, the statistical analysis conducted on geographies consisting of 174,111,110 people shows a poor negative correlation between the proportion of Immigrants from Syria and per capita income in the United States with a correlation coefficient (R) of -0.200 and weighted average of $45,218, a difference of 1.9%.
Per Capita Income Correlation Summary
| Measurement | Chinese | Immigrants from Syria |
| Minimum | $22,765 | $23,901 |
| Maximum | $76,789 | $102,814 |
| Range | $54,024 | $78,913 |
| Mean | $44,105 | $45,572 |
| Median | $44,514 | $43,422 |
| Interquartile 25% (IQ1) | $38,432 | $40,433 |
| Interquartile 75% (IQ3) | $49,089 | $48,863 |
| Interquartile Range (IQR) | $10,657 | $8,430 |
| Standard Deviation (Sample) | $10,226 | $13,127 |
| Standard Deviation (Population) | $10,137 | $13,017 |
Demographics Similar to Chinese and Immigrants from Syria by Per Capita Income
In terms of per capita income, the demographic groups most similar to Chinese are Immigrants from Saudi Arabia ($46,008, a difference of 0.19%), Immigrants from Poland ($45,979, a difference of 0.26%), Immigrants from Ethiopia ($45,923, a difference of 0.38%), Canadian ($45,858, a difference of 0.52%), and Moroccan ($45,854, a difference of 0.53%). Similarly, the demographic groups most similar to Immigrants from Syria are Immigrants from Oceania ($45,220, a difference of 0.0%), Hungarian ($45,426, a difference of 0.46%), Slovene ($45,581, a difference of 0.80%), Pakistani ($45,587, a difference of 0.82%), and Jordanian ($45,605, a difference of 0.86%).
| Demographics | Rating | Rank | Per Capita Income |
| Chinese | 93.9 /100 | #117 | Exceptional $46,098 |
| Immigrants | Saudi Arabia | 93.3 /100 | #118 | Exceptional $46,008 |
| Immigrants | Poland | 93.1 /100 | #119 | Exceptional $45,979 |
| Immigrants | Ethiopia | 92.7 /100 | #120 | Exceptional $45,923 |
| Canadians | 92.2 /100 | #121 | Exceptional $45,858 |
| Moroccans | 92.1 /100 | #122 | Exceptional $45,854 |
| Lebanese | 92.0 /100 | #123 | Exceptional $45,840 |
| Europeans | 92.0 /100 | #124 | Exceptional $45,836 |
| Zimbabweans | 91.7 /100 | #125 | Exceptional $45,804 |
| Palestinians | 91.6 /100 | #126 | Exceptional $45,790 |
| Immigrants | Germany | 91.3 /100 | #127 | Exceptional $45,751 |
| Swedes | 91.3 /100 | #128 | Exceptional $45,750 |
| Luxembourgers | 90.4 /100 | #129 | Exceptional $45,663 |
| Arabs | 90.4 /100 | #130 | Exceptional $45,662 |
| Immigrants | North Macedonia | 90.0 /100 | #131 | Exceptional $45,622 |
| Jordanians | 89.9 /100 | #132 | Excellent $45,605 |
| Pakistanis | 89.7 /100 | #133 | Excellent $45,587 |
| Slovenes | 89.6 /100 | #134 | Excellent $45,581 |
| Hungarians | 87.9 /100 | #135 | Excellent $45,426 |
| Immigrants | Oceania | 85.2 /100 | #136 | Excellent $45,220 |
| Immigrants | Syria | 85.2 /100 | #137 | Excellent $45,218 |