Chinese vs Sri Lankan Per Capita Income
COMPARE
Chinese
Sri Lankan
Per Capita Income
Per Capita Income Comparison
Chinese
Sri Lankans
$46,098
PER CAPITA INCOME
93.9/ 100
METRIC RATING
117th/ 347
METRIC RANK
$44,014
PER CAPITA INCOME
59.8/ 100
METRIC RATING
164th/ 347
METRIC RANK
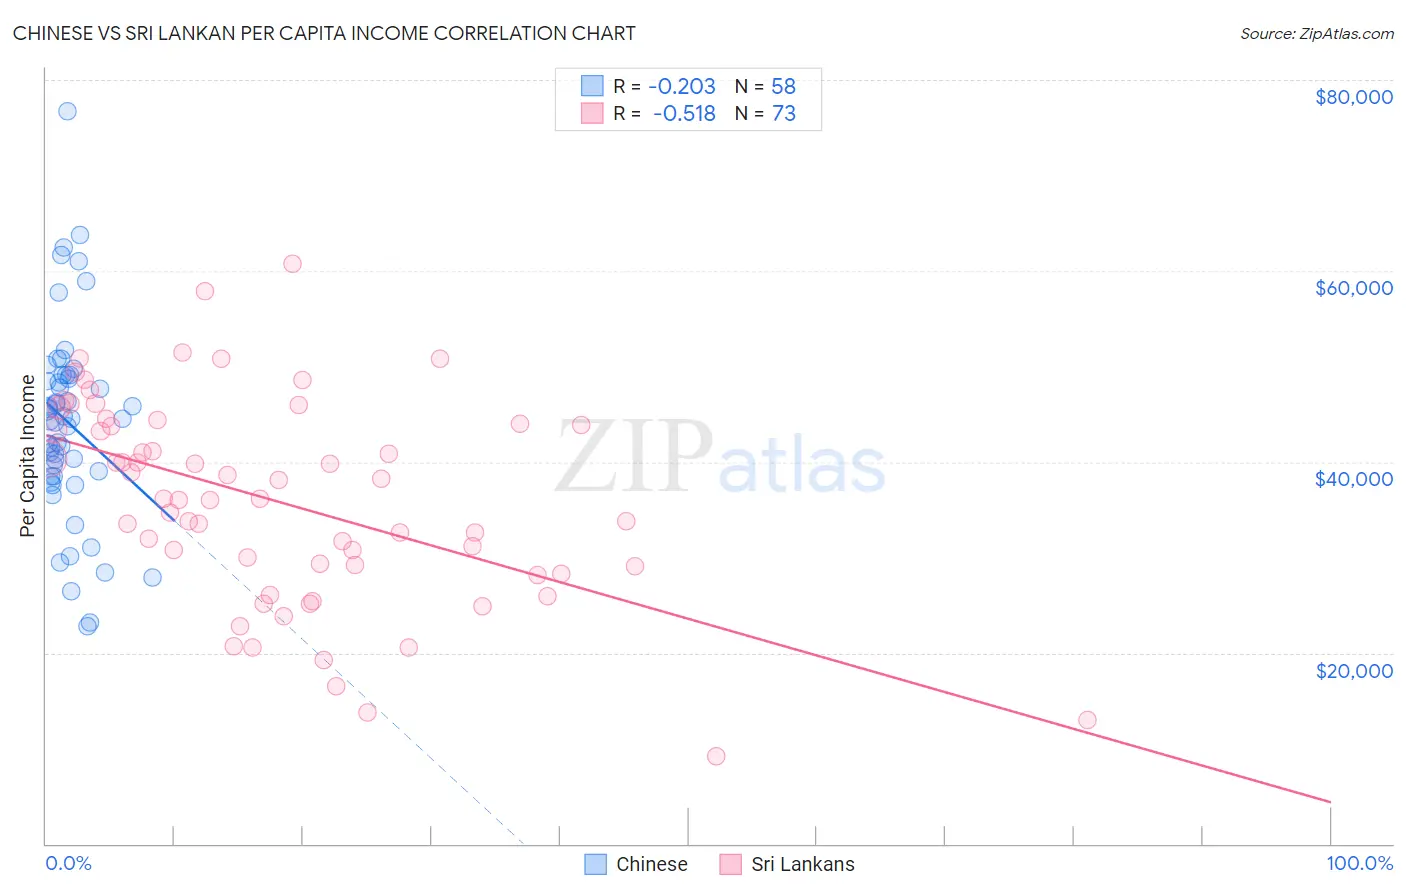
Chinese vs Sri Lankan Per Capita Income Correlation Chart
The statistical analysis conducted on geographies consisting of 64,809,125 people shows a weak negative correlation between the proportion of Chinese and per capita income in the United States with a correlation coefficient (R) of -0.203 and weighted average of $46,098. Similarly, the statistical analysis conducted on geographies consisting of 440,642,250 people shows a substantial negative correlation between the proportion of Sri Lankans and per capita income in the United States with a correlation coefficient (R) of -0.518 and weighted average of $44,014, a difference of 4.7%.
Per Capita Income Correlation Summary
| Measurement | Chinese | Sri Lankan |
| Minimum | $22,765 | $9,224 |
| Maximum | $76,789 | $60,722 |
| Range | $54,024 | $51,498 |
| Mean | $44,105 | $35,781 |
| Median | $44,514 | $36,115 |
| Interquartile 25% (IQ1) | $38,432 | $28,668 |
| Interquartile 75% (IQ3) | $49,089 | $43,934 |
| Interquartile Range (IQR) | $10,657 | $15,265 |
| Standard Deviation (Sample) | $10,226 | $10,742 |
| Standard Deviation (Population) | $10,137 | $10,669 |
Similar Demographics by Per Capita Income
Demographics Similar to Chinese by Per Capita Income
In terms of per capita income, the demographic groups most similar to Chinese are Polish ($46,123, a difference of 0.050%), Immigrants from Saudi Arabia ($46,008, a difference of 0.19%), Immigrants from Chile ($46,213, a difference of 0.25%), Immigrants from Poland ($45,979, a difference of 0.26%), and Afghan ($46,268, a difference of 0.37%).
| Demographics | Rating | Rank | Per Capita Income |
| Chileans | 95.9 /100 | #110 | Exceptional $46,459 |
| Taiwanese | 95.8 /100 | #111 | Exceptional $46,455 |
| Immigrants | Morocco | 95.7 /100 | #112 | Exceptional $46,430 |
| Immigrants | Albania | 95.5 /100 | #113 | Exceptional $46,387 |
| Afghans | 94.9 /100 | #114 | Exceptional $46,268 |
| Immigrants | Chile | 94.6 /100 | #115 | Exceptional $46,213 |
| Poles | 94.1 /100 | #116 | Exceptional $46,123 |
| Chinese | 93.9 /100 | #117 | Exceptional $46,098 |
| Immigrants | Saudi Arabia | 93.3 /100 | #118 | Exceptional $46,008 |
| Immigrants | Poland | 93.1 /100 | #119 | Exceptional $45,979 |
| Immigrants | Ethiopia | 92.7 /100 | #120 | Exceptional $45,923 |
| Canadians | 92.2 /100 | #121 | Exceptional $45,858 |
| Moroccans | 92.1 /100 | #122 | Exceptional $45,854 |
| Lebanese | 92.0 /100 | #123 | Exceptional $45,840 |
| Europeans | 92.0 /100 | #124 | Exceptional $45,836 |
Demographics Similar to Sri Lankans by Per Capita Income
In terms of per capita income, the demographic groups most similar to Sri Lankans are Immigrants from Philippines ($44,000, a difference of 0.030%), Immigrants from Uruguay ($43,997, a difference of 0.040%), English ($43,982, a difference of 0.070%), Immigrants from South America ($44,068, a difference of 0.12%), and Swiss ($44,076, a difference of 0.14%).
| Demographics | Rating | Rank | Per Capita Income |
| South American Indians | 64.8 /100 | #157 | Good $44,206 |
| Immigrants | Nepal | 64.3 /100 | #158 | Good $44,187 |
| South Americans | 62.4 /100 | #159 | Good $44,114 |
| Danes | 61.9 /100 | #160 | Good $44,095 |
| Costa Ricans | 61.8 /100 | #161 | Good $44,090 |
| Swiss | 61.4 /100 | #162 | Good $44,076 |
| Immigrants | South America | 61.2 /100 | #163 | Good $44,068 |
| Sri Lankans | 59.8 /100 | #164 | Average $44,014 |
| Immigrants | Philippines | 59.4 /100 | #165 | Average $44,000 |
| Immigrants | Uruguay | 59.3 /100 | #166 | Average $43,997 |
| English | 58.9 /100 | #167 | Average $43,982 |
| Belgians | 58.1 /100 | #168 | Average $43,951 |
| Immigrants | Peru | 55.3 /100 | #169 | Average $43,852 |
| Scandinavians | 55.2 /100 | #170 | Average $43,848 |
| Immigrants | Eastern Africa | 54.9 /100 | #171 | Average $43,838 |