Danish vs Austrian Per Capita Income
COMPARE
Danish
Austrian
Per Capita Income
Per Capita Income Comparison
Danes
Austrians
$44,095
PER CAPITA INCOME
61.9/ 100
METRIC RATING
160th/ 347
METRIC RANK
$48,116
PER CAPITA INCOME
99.3/ 100
METRIC RATING
85th/ 347
METRIC RANK
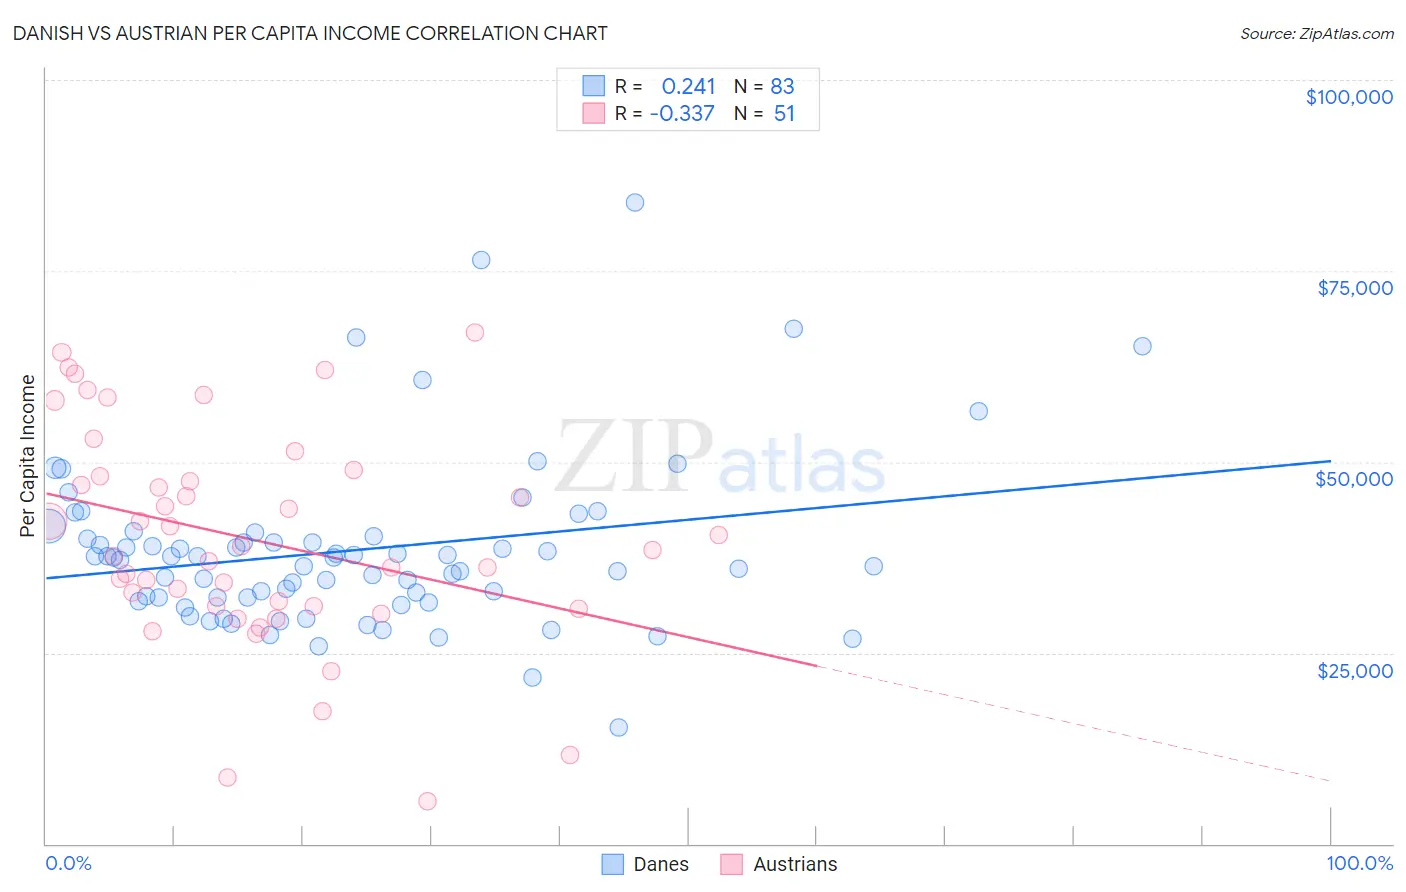
Danish vs Austrian Per Capita Income Correlation Chart
The statistical analysis conducted on geographies consisting of 474,208,442 people shows a weak positive correlation between the proportion of Danes and per capita income in the United States with a correlation coefficient (R) of 0.241 and weighted average of $44,095. Similarly, the statistical analysis conducted on geographies consisting of 452,103,489 people shows a mild negative correlation between the proportion of Austrians and per capita income in the United States with a correlation coefficient (R) of -0.337 and weighted average of $48,116, a difference of 9.1%.
Per Capita Income Correlation Summary
| Measurement | Danish | Austrian |
| Minimum | $15,232 | $5,500 |
| Maximum | $83,892 | $66,908 |
| Range | $68,660 | $61,408 |
| Mean | $38,430 | $39,852 |
| Median | $37,481 | $38,439 |
| Interquartile 25% (IQ1) | $32,272 | $31,067 |
| Interquartile 75% (IQ3) | $40,294 | $48,128 |
| Interquartile Range (IQR) | $8,022 | $17,061 |
| Standard Deviation (Sample) | $11,196 | $14,137 |
| Standard Deviation (Population) | $11,128 | $13,998 |
Similar Demographics by Per Capita Income
Demographics Similar to Danes by Per Capita Income
In terms of per capita income, the demographic groups most similar to Danes are Costa Rican ($44,090, a difference of 0.010%), South American ($44,114, a difference of 0.040%), Swiss ($44,076, a difference of 0.040%), Immigrants from South America ($44,068, a difference of 0.060%), and Sri Lankan ($44,014, a difference of 0.18%).
| Demographics | Rating | Rank | Per Capita Income |
| Scottish | 70.6 /100 | #153 | Good $44,440 |
| Portuguese | 68.7 /100 | #154 | Good $44,362 |
| Uruguayans | 67.6 /100 | #155 | Good $44,318 |
| Slovaks | 65.4 /100 | #156 | Good $44,229 |
| South American Indians | 64.8 /100 | #157 | Good $44,206 |
| Immigrants | Nepal | 64.3 /100 | #158 | Good $44,187 |
| South Americans | 62.4 /100 | #159 | Good $44,114 |
| Danes | 61.9 /100 | #160 | Good $44,095 |
| Costa Ricans | 61.8 /100 | #161 | Good $44,090 |
| Swiss | 61.4 /100 | #162 | Good $44,076 |
| Immigrants | South America | 61.2 /100 | #163 | Good $44,068 |
| Sri Lankans | 59.8 /100 | #164 | Average $44,014 |
| Immigrants | Philippines | 59.4 /100 | #165 | Average $44,000 |
| Immigrants | Uruguay | 59.3 /100 | #166 | Average $43,997 |
| English | 58.9 /100 | #167 | Average $43,982 |
Demographics Similar to Austrians by Per Capita Income
In terms of per capita income, the demographic groups most similar to Austrians are Immigrants from Ukraine ($48,134, a difference of 0.040%), Immigrants from Brazil ($48,164, a difference of 0.10%), Immigrants from Indonesia ($48,195, a difference of 0.16%), Immigrants from Southern Europe ($48,027, a difference of 0.18%), and Ukrainian ($48,014, a difference of 0.21%).
| Demographics | Rating | Rank | Per Capita Income |
| Immigrants | Italy | 99.6 /100 | #78 | Exceptional $48,654 |
| Romanians | 99.5 /100 | #79 | Exceptional $48,445 |
| Egyptians | 99.5 /100 | #80 | Exceptional $48,358 |
| Armenians | 99.4 /100 | #81 | Exceptional $48,287 |
| Immigrants | Indonesia | 99.4 /100 | #82 | Exceptional $48,195 |
| Immigrants | Brazil | 99.4 /100 | #83 | Exceptional $48,164 |
| Immigrants | Ukraine | 99.3 /100 | #84 | Exceptional $48,134 |
| Austrians | 99.3 /100 | #85 | Exceptional $48,116 |
| Immigrants | Southern Europe | 99.3 /100 | #86 | Exceptional $48,027 |
| Ukrainians | 99.3 /100 | #87 | Exceptional $48,014 |
| Croatians | 99.0 /100 | #88 | Exceptional $47,742 |
| Northern Europeans | 98.9 /100 | #89 | Exceptional $47,698 |
| Italians | 98.8 /100 | #90 | Exceptional $47,574 |
| Macedonians | 98.8 /100 | #91 | Exceptional $47,573 |
| Immigrants | Moldova | 98.7 /100 | #92 | Exceptional $47,489 |