Celtic vs Basque Median Male Earnings
COMPARE
Celtic
Basque
Median Male Earnings
Median Male Earnings Comparison
Celtics
Basques
$54,242
MEDIAN MALE EARNINGS
43.9/ 100
METRIC RATING
179th/ 347
METRIC RANK
$55,370
MEDIAN MALE EARNINGS
70.3/ 100
METRIC RATING
160th/ 347
METRIC RANK
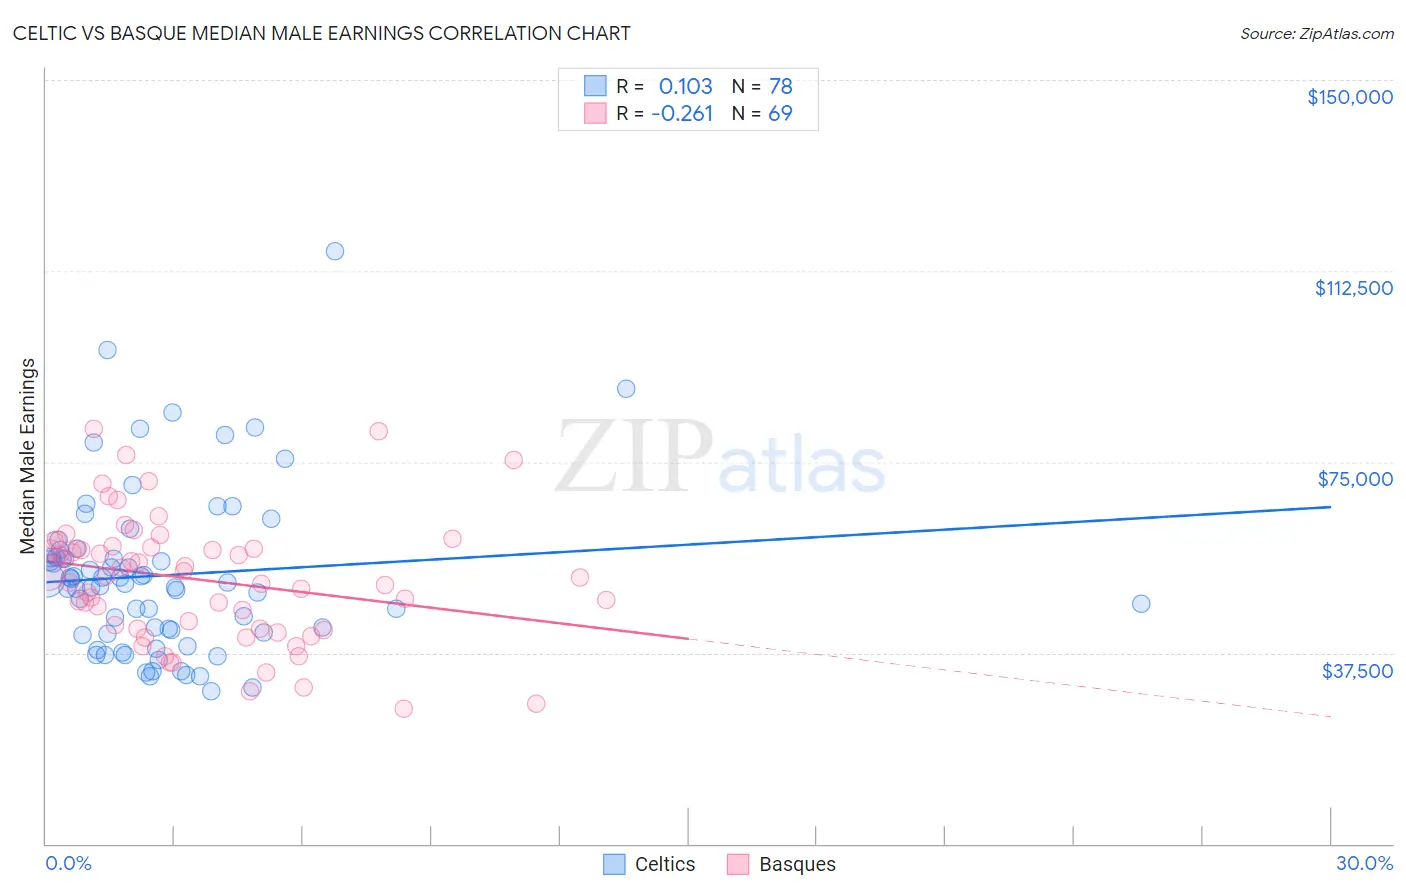
Celtic vs Basque Median Male Earnings Correlation Chart
The statistical analysis conducted on geographies consisting of 168,835,253 people shows a poor positive correlation between the proportion of Celtics and median male earnings in the United States with a correlation coefficient (R) of 0.103 and weighted average of $54,242. Similarly, the statistical analysis conducted on geographies consisting of 165,750,902 people shows a weak negative correlation between the proportion of Basques and median male earnings in the United States with a correlation coefficient (R) of -0.261 and weighted average of $55,370, a difference of 2.1%.
Median Male Earnings Correlation Summary
| Measurement | Celtic | Basque |
| Minimum | $30,000 | $26,442 |
| Maximum | $116,250 | $81,428 |
| Range | $86,250 | $54,986 |
| Mean | $52,737 | $51,886 |
| Median | $51,157 | $52,492 |
| Interquartile 25% (IQ1) | $41,563 | $42,224 |
| Interquartile 75% (IQ3) | $56,235 | $58,280 |
| Interquartile Range (IQR) | $14,672 | $16,056 |
| Standard Deviation (Sample) | $16,099 | $12,223 |
| Standard Deviation (Population) | $15,995 | $12,134 |
Demographics Similar to Celtics and Basques by Median Male Earnings
In terms of median male earnings, the demographic groups most similar to Celtics are Costa Rican ($54,279, a difference of 0.070%), Sierra Leonean ($54,279, a difference of 0.070%), Spaniard ($54,401, a difference of 0.29%), Dutch ($54,410, a difference of 0.31%), and South American ($54,492, a difference of 0.46%). Similarly, the demographic groups most similar to Basques are Alsatian ($55,380, a difference of 0.020%), Belgian ($55,361, a difference of 0.020%), French ($55,350, a difference of 0.040%), Ugandan ($55,290, a difference of 0.15%), and Immigrants from South Eastern Asia ($55,241, a difference of 0.23%).
| Demographics | Rating | Rank | Median Male Earnings |
| Alsatians | 70.5 /100 | #159 | Good $55,380 |
| Basques | 70.3 /100 | #160 | Good $55,370 |
| Belgians | 70.1 /100 | #161 | Good $55,361 |
| French | 69.9 /100 | #162 | Good $55,350 |
| Ugandans | 68.6 /100 | #163 | Good $55,290 |
| Immigrants | South Eastern Asia | 67.6 /100 | #164 | Good $55,241 |
| Immigrants | Portugal | 66.3 /100 | #165 | Good $55,182 |
| Germans | 61.6 /100 | #166 | Good $54,974 |
| Immigrants | Fiji | 61.2 /100 | #167 | Good $54,958 |
| Immigrants | Vietnam | 60.2 /100 | #168 | Good $54,913 |
| French Canadians | 55.6 /100 | #169 | Average $54,722 |
| Finns | 55.6 /100 | #170 | Average $54,721 |
| Immigrants | Peru | 54.9 /100 | #171 | Average $54,695 |
| Welsh | 53.8 /100 | #172 | Average $54,647 |
| South American Indians | 50.4 /100 | #173 | Average $54,508 |
| South Americans | 50.0 /100 | #174 | Average $54,492 |
| Dutch | 48.0 /100 | #175 | Average $54,410 |
| Spaniards | 47.8 /100 | #176 | Average $54,401 |
| Costa Ricans | 44.8 /100 | #177 | Average $54,279 |
| Sierra Leoneans | 44.8 /100 | #178 | Average $54,279 |
| Celtics | 43.9 /100 | #179 | Average $54,242 |