Celtic vs Mexican Median Male Earnings
COMPARE
Celtic
Mexican
Median Male Earnings
Median Male Earnings Comparison
Celtics
Mexicans
$54,242
MEDIAN MALE EARNINGS
43.9/ 100
METRIC RATING
179th/ 347
METRIC RANK
$46,147
MEDIAN MALE EARNINGS
0.0/ 100
METRIC RATING
317th/ 347
METRIC RANK
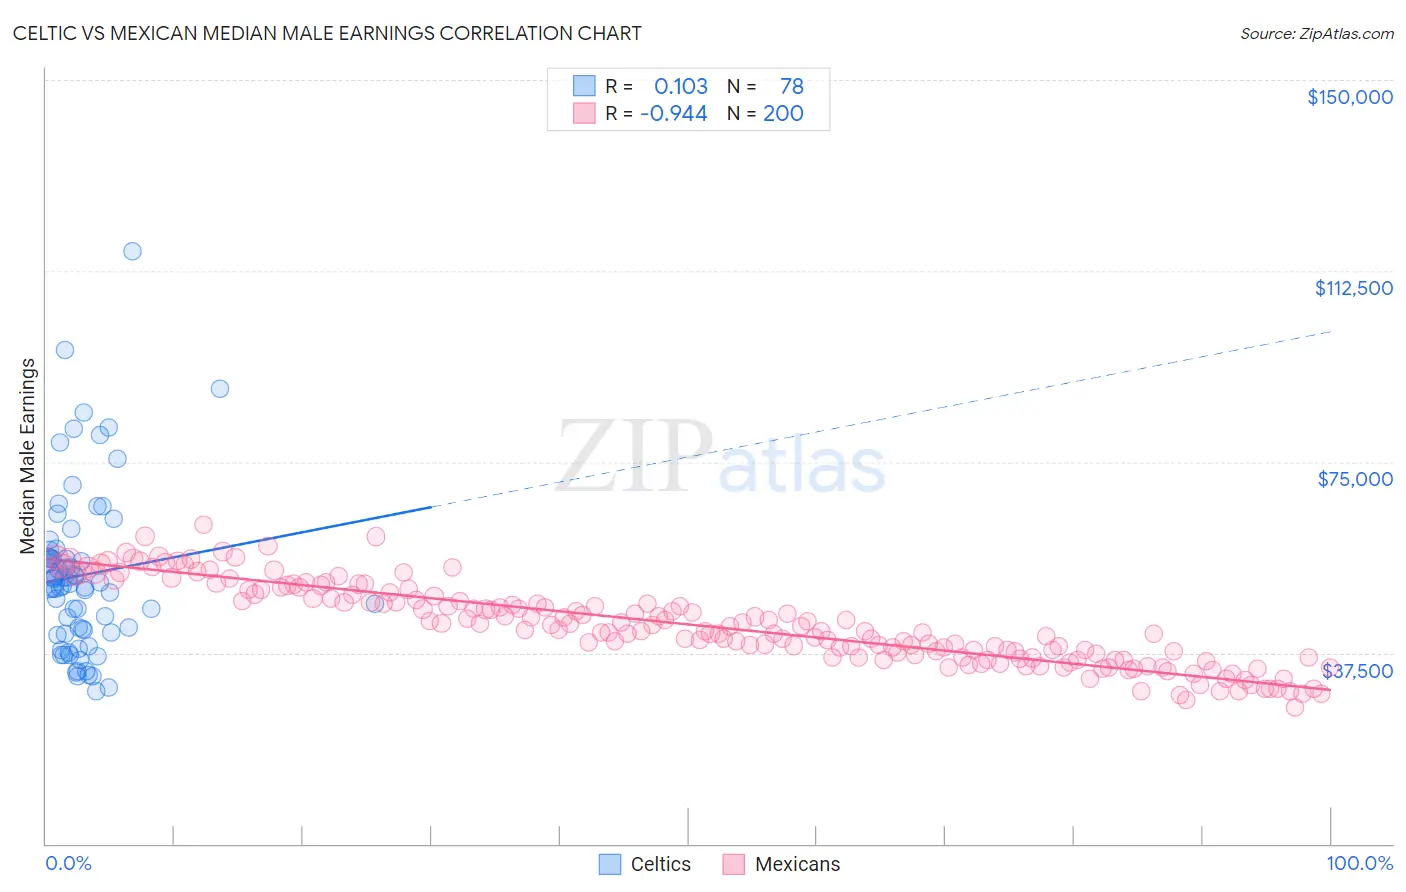
Celtic vs Mexican Median Male Earnings Correlation Chart
The statistical analysis conducted on geographies consisting of 168,835,253 people shows a poor positive correlation between the proportion of Celtics and median male earnings in the United States with a correlation coefficient (R) of 0.103 and weighted average of $54,242. Similarly, the statistical analysis conducted on geographies consisting of 564,183,218 people shows a near-perfect negative correlation between the proportion of Mexicans and median male earnings in the United States with a correlation coefficient (R) of -0.944 and weighted average of $46,147, a difference of 17.5%.
Median Male Earnings Correlation Summary
| Measurement | Celtic | Mexican |
| Minimum | $30,000 | $26,771 |
| Maximum | $116,250 | $62,671 |
| Range | $86,250 | $35,900 |
| Mean | $52,737 | $43,079 |
| Median | $51,157 | $42,356 |
| Interquartile 25% (IQ1) | $41,563 | $36,668 |
| Interquartile 75% (IQ3) | $56,235 | $48,978 |
| Interquartile Range (IQR) | $14,672 | $12,309 |
| Standard Deviation (Sample) | $16,099 | $7,897 |
| Standard Deviation (Population) | $15,995 | $7,878 |
Similar Demographics by Median Male Earnings
Demographics Similar to Celtics by Median Male Earnings
In terms of median male earnings, the demographic groups most similar to Celtics are Costa Rican ($54,279, a difference of 0.070%), Sierra Leonean ($54,279, a difference of 0.070%), Iraqi ($54,182, a difference of 0.11%), Immigrants ($54,168, a difference of 0.14%), and Spaniard ($54,401, a difference of 0.29%).
| Demographics | Rating | Rank | Median Male Earnings |
| Welsh | 53.8 /100 | #172 | Average $54,647 |
| South American Indians | 50.4 /100 | #173 | Average $54,508 |
| South Americans | 50.0 /100 | #174 | Average $54,492 |
| Dutch | 48.0 /100 | #175 | Average $54,410 |
| Spaniards | 47.8 /100 | #176 | Average $54,401 |
| Costa Ricans | 44.8 /100 | #177 | Average $54,279 |
| Sierra Leoneans | 44.8 /100 | #178 | Average $54,279 |
| Celtics | 43.9 /100 | #179 | Average $54,242 |
| Iraqis | 42.5 /100 | #180 | Average $54,182 |
| Immigrants | Immigrants | 42.1 /100 | #181 | Average $54,168 |
| Yugoslavians | 37.4 /100 | #182 | Fair $53,967 |
| Immigrants | South America | 37.3 /100 | #183 | Fair $53,962 |
| Whites/Caucasians | 36.5 /100 | #184 | Fair $53,925 |
| Immigrants | Sierra Leone | 36.0 /100 | #185 | Fair $53,905 |
| Colombians | 34.4 /100 | #186 | Fair $53,832 |
Demographics Similar to Mexicans by Median Male Earnings
In terms of median male earnings, the demographic groups most similar to Mexicans are Immigrants from Caribbean ($46,193, a difference of 0.10%), Cheyenne ($46,062, a difference of 0.18%), Immigrants from Guatemala ($46,244, a difference of 0.21%), Chippewa ($46,368, a difference of 0.48%), and Honduran ($46,374, a difference of 0.49%).
| Demographics | Rating | Rank | Median Male Earnings |
| Cubans | 0.0 /100 | #310 | Tragic $46,580 |
| Apache | 0.0 /100 | #311 | Tragic $46,429 |
| Hispanics or Latinos | 0.0 /100 | #312 | Tragic $46,419 |
| Hondurans | 0.0 /100 | #313 | Tragic $46,374 |
| Chippewa | 0.0 /100 | #314 | Tragic $46,368 |
| Immigrants | Guatemala | 0.0 /100 | #315 | Tragic $46,244 |
| Immigrants | Caribbean | 0.0 /100 | #316 | Tragic $46,193 |
| Mexicans | 0.0 /100 | #317 | Tragic $46,147 |
| Cheyenne | 0.0 /100 | #318 | Tragic $46,062 |
| Haitians | 0.0 /100 | #319 | Tragic $45,903 |
| Immigrants | Honduras | 0.0 /100 | #320 | Tragic $45,787 |
| Fijians | 0.0 /100 | #321 | Tragic $45,607 |
| Sioux | 0.0 /100 | #322 | Tragic $45,566 |
| Immigrants | Central America | 0.0 /100 | #323 | Tragic $45,538 |
| Blacks/African Americans | 0.0 /100 | #324 | Tragic $45,523 |