Celtic vs Tohono O'odham Median Male Earnings
COMPARE
Celtic
Tohono O'odham
Median Male Earnings
Median Male Earnings Comparison
Celtics
Tohono O'odham
$54,242
MEDIAN MALE EARNINGS
43.9/ 100
METRIC RATING
179th/ 347
METRIC RANK
$39,543
MEDIAN MALE EARNINGS
0.0/ 100
METRIC RATING
346th/ 347
METRIC RANK
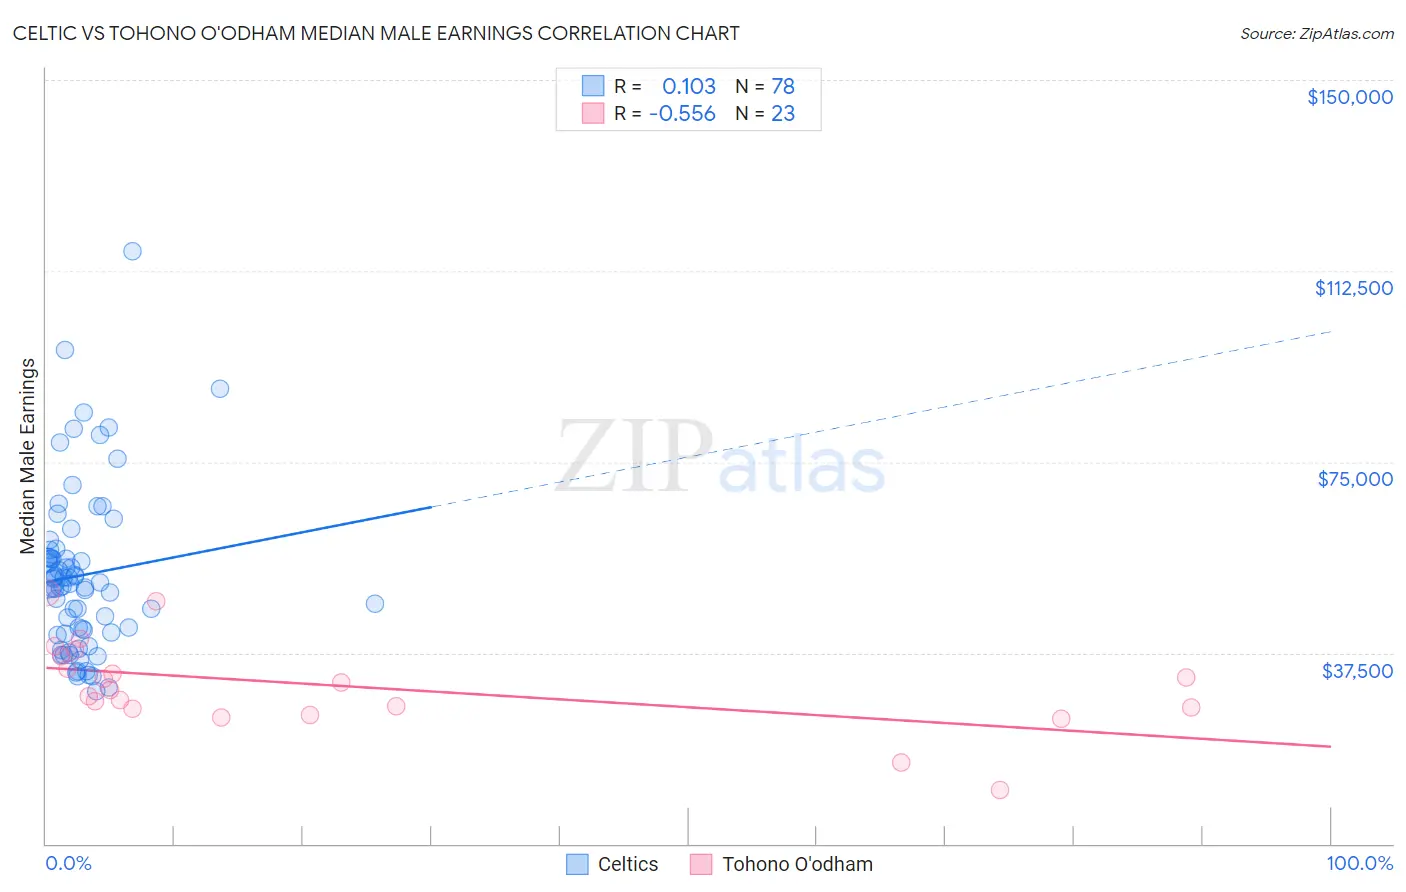
Celtic vs Tohono O'odham Median Male Earnings Correlation Chart
The statistical analysis conducted on geographies consisting of 168,835,253 people shows a poor positive correlation between the proportion of Celtics and median male earnings in the United States with a correlation coefficient (R) of 0.103 and weighted average of $54,242. Similarly, the statistical analysis conducted on geographies consisting of 58,721,947 people shows a substantial negative correlation between the proportion of Tohono O'odham and median male earnings in the United States with a correlation coefficient (R) of -0.556 and weighted average of $39,543, a difference of 37.2%.
Median Male Earnings Correlation Summary
| Measurement | Celtic | Tohono O'odham |
| Minimum | $30,000 | $10,662 |
| Maximum | $116,250 | $49,303 |
| Range | $86,250 | $38,641 |
| Mean | $52,737 | $30,964 |
| Median | $51,157 | $30,247 |
| Interquartile 25% (IQ1) | $41,563 | $26,584 |
| Interquartile 75% (IQ3) | $56,235 | $36,724 |
| Interquartile Range (IQR) | $14,672 | $10,140 |
| Standard Deviation (Sample) | $16,099 | $8,763 |
| Standard Deviation (Population) | $15,995 | $8,570 |
Similar Demographics by Median Male Earnings
Demographics Similar to Celtics by Median Male Earnings
In terms of median male earnings, the demographic groups most similar to Celtics are Costa Rican ($54,279, a difference of 0.070%), Sierra Leonean ($54,279, a difference of 0.070%), Iraqi ($54,182, a difference of 0.11%), Immigrants ($54,168, a difference of 0.14%), and Spaniard ($54,401, a difference of 0.29%).
| Demographics | Rating | Rank | Median Male Earnings |
| Welsh | 53.8 /100 | #172 | Average $54,647 |
| South American Indians | 50.4 /100 | #173 | Average $54,508 |
| South Americans | 50.0 /100 | #174 | Average $54,492 |
| Dutch | 48.0 /100 | #175 | Average $54,410 |
| Spaniards | 47.8 /100 | #176 | Average $54,401 |
| Costa Ricans | 44.8 /100 | #177 | Average $54,279 |
| Sierra Leoneans | 44.8 /100 | #178 | Average $54,279 |
| Celtics | 43.9 /100 | #179 | Average $54,242 |
| Iraqis | 42.5 /100 | #180 | Average $54,182 |
| Immigrants | Immigrants | 42.1 /100 | #181 | Average $54,168 |
| Yugoslavians | 37.4 /100 | #182 | Fair $53,967 |
| Immigrants | South America | 37.3 /100 | #183 | Fair $53,962 |
| Whites/Caucasians | 36.5 /100 | #184 | Fair $53,925 |
| Immigrants | Sierra Leone | 36.0 /100 | #185 | Fair $53,905 |
| Colombians | 34.4 /100 | #186 | Fair $53,832 |
Demographics Similar to Tohono O'odham by Median Male Earnings
In terms of median male earnings, the demographic groups most similar to Tohono O'odham are Yup'ik ($39,504, a difference of 0.10%), Puerto Rican ($40,071, a difference of 1.3%), Pueblo ($41,314, a difference of 4.5%), Lumbee ($41,715, a difference of 5.5%), and Arapaho ($41,758, a difference of 5.6%).
| Demographics | Rating | Rank | Median Male Earnings |
| Immigrants | Congo | 0.0 /100 | #333 | Tragic $44,204 |
| Immigrants | Yemen | 0.0 /100 | #334 | Tragic $44,083 |
| Spanish American Indians | 0.0 /100 | #335 | Tragic $44,010 |
| Immigrants | Cuba | 0.0 /100 | #336 | Tragic $43,461 |
| Menominee | 0.0 /100 | #337 | Tragic $42,581 |
| Crow | 0.0 /100 | #338 | Tragic $42,434 |
| Pima | 0.0 /100 | #339 | Tragic $42,357 |
| Navajo | 0.0 /100 | #340 | Tragic $42,098 |
| Hopi | 0.0 /100 | #341 | Tragic $42,060 |
| Arapaho | 0.0 /100 | #342 | Tragic $41,758 |
| Lumbee | 0.0 /100 | #343 | Tragic $41,715 |
| Pueblo | 0.0 /100 | #344 | Tragic $41,314 |
| Puerto Ricans | 0.0 /100 | #345 | Tragic $40,071 |
| Tohono O'odham | 0.0 /100 | #346 | Tragic $39,543 |
| Yup'ik | 0.0 /100 | #347 | Tragic $39,504 |