Serbian vs Basque Median Male Earnings
COMPARE
Serbian
Basque
Median Male Earnings
Median Male Earnings Comparison
Serbians
Basques
$57,975
MEDIAN MALE EARNINGS
96.8/ 100
METRIC RATING
107th/ 347
METRIC RANK
$55,370
MEDIAN MALE EARNINGS
70.3/ 100
METRIC RATING
160th/ 347
METRIC RANK
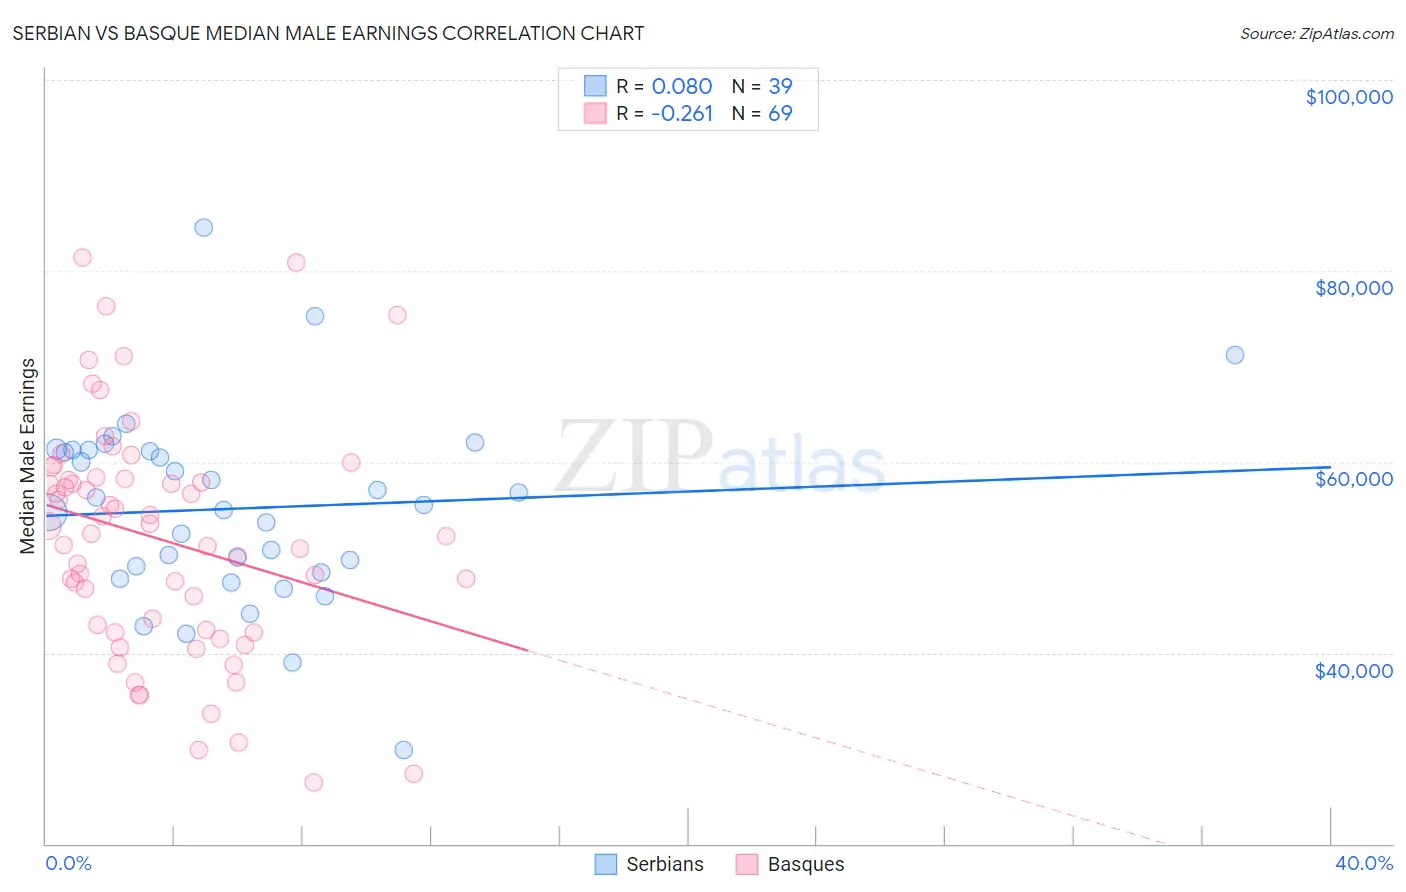
Serbian vs Basque Median Male Earnings Correlation Chart
The statistical analysis conducted on geographies consisting of 267,612,597 people shows a slight positive correlation between the proportion of Serbians and median male earnings in the United States with a correlation coefficient (R) of 0.080 and weighted average of $57,975. Similarly, the statistical analysis conducted on geographies consisting of 165,750,902 people shows a weak negative correlation between the proportion of Basques and median male earnings in the United States with a correlation coefficient (R) of -0.261 and weighted average of $55,370, a difference of 4.7%.
Median Male Earnings Correlation Summary
| Measurement | Serbian | Basque |
| Minimum | $29,881 | $26,442 |
| Maximum | $84,510 | $81,428 |
| Range | $54,629 | $54,986 |
| Mean | $55,134 | $51,886 |
| Median | $55,532 | $52,492 |
| Interquartile 25% (IQ1) | $48,361 | $42,224 |
| Interquartile 75% (IQ3) | $61,216 | $58,280 |
| Interquartile Range (IQR) | $12,855 | $16,056 |
| Standard Deviation (Sample) | $10,037 | $12,223 |
| Standard Deviation (Population) | $9,908 | $12,134 |
Similar Demographics by Median Male Earnings
Demographics Similar to Serbians by Median Male Earnings
In terms of median male earnings, the demographic groups most similar to Serbians are Immigrants from Northern Africa ($58,008, a difference of 0.060%), Immigrants from Uzbekistan ($57,941, a difference of 0.060%), British ($57,890, a difference of 0.15%), Armenian ($58,134, a difference of 0.27%), and Immigrants from Western Asia ($58,131, a difference of 0.27%).
| Demographics | Rating | Rank | Median Male Earnings |
| Assyrians/Chaldeans/Syriacs | 97.9 /100 | #100 | Exceptional $58,437 |
| Immigrants | Brazil | 97.7 /100 | #101 | Exceptional $58,324 |
| Syrians | 97.4 /100 | #102 | Exceptional $58,187 |
| Poles | 97.3 /100 | #103 | Exceptional $58,139 |
| Armenians | 97.3 /100 | #104 | Exceptional $58,134 |
| Immigrants | Western Asia | 97.3 /100 | #105 | Exceptional $58,131 |
| Immigrants | Northern Africa | 96.9 /100 | #106 | Exceptional $58,008 |
| Serbians | 96.8 /100 | #107 | Exceptional $57,975 |
| Immigrants | Uzbekistan | 96.7 /100 | #108 | Exceptional $57,941 |
| British | 96.5 /100 | #109 | Exceptional $57,890 |
| Palestinians | 96.2 /100 | #110 | Exceptional $57,778 |
| Europeans | 95.6 /100 | #111 | Exceptional $57,637 |
| Immigrants | Afghanistan | 95.4 /100 | #112 | Exceptional $57,582 |
| Carpatho Rusyns | 95.3 /100 | #113 | Exceptional $57,572 |
| Immigrants | Kuwait | 95.3 /100 | #114 | Exceptional $57,562 |
Demographics Similar to Basques by Median Male Earnings
In terms of median male earnings, the demographic groups most similar to Basques are Czechoslovakian ($55,382, a difference of 0.020%), Alsatian ($55,380, a difference of 0.020%), Belgian ($55,361, a difference of 0.020%), French ($55,350, a difference of 0.040%), and Icelander ($55,415, a difference of 0.080%).
| Demographics | Rating | Rank | Median Male Earnings |
| Immigrants | Nepal | 75.0 /100 | #153 | Good $55,615 |
| Taiwanese | 73.9 /100 | #154 | Good $55,556 |
| Scandinavians | 73.4 /100 | #155 | Good $55,527 |
| Immigrants | Ethiopia | 71.6 /100 | #156 | Good $55,434 |
| Icelanders | 71.2 /100 | #157 | Good $55,415 |
| Czechoslovakians | 70.5 /100 | #158 | Good $55,382 |
| Alsatians | 70.5 /100 | #159 | Good $55,380 |
| Basques | 70.3 /100 | #160 | Good $55,370 |
| Belgians | 70.1 /100 | #161 | Good $55,361 |
| French | 69.9 /100 | #162 | Good $55,350 |
| Ugandans | 68.6 /100 | #163 | Good $55,290 |
| Immigrants | South Eastern Asia | 67.6 /100 | #164 | Good $55,241 |
| Immigrants | Portugal | 66.3 /100 | #165 | Good $55,182 |
| Germans | 61.6 /100 | #166 | Good $54,974 |
| Immigrants | Fiji | 61.2 /100 | #167 | Good $54,958 |