Canadian vs Macedonian Median Male Earnings
COMPARE
Canadian
Macedonian
Median Male Earnings
Median Male Earnings Comparison
Canadians
Macedonians
$57,286
MEDIAN MALE EARNINGS
93.9/ 100
METRIC RATING
120th/ 347
METRIC RANK
$59,522
MEDIAN MALE EARNINGS
99.3/ 100
METRIC RATING
87th/ 347
METRIC RANK
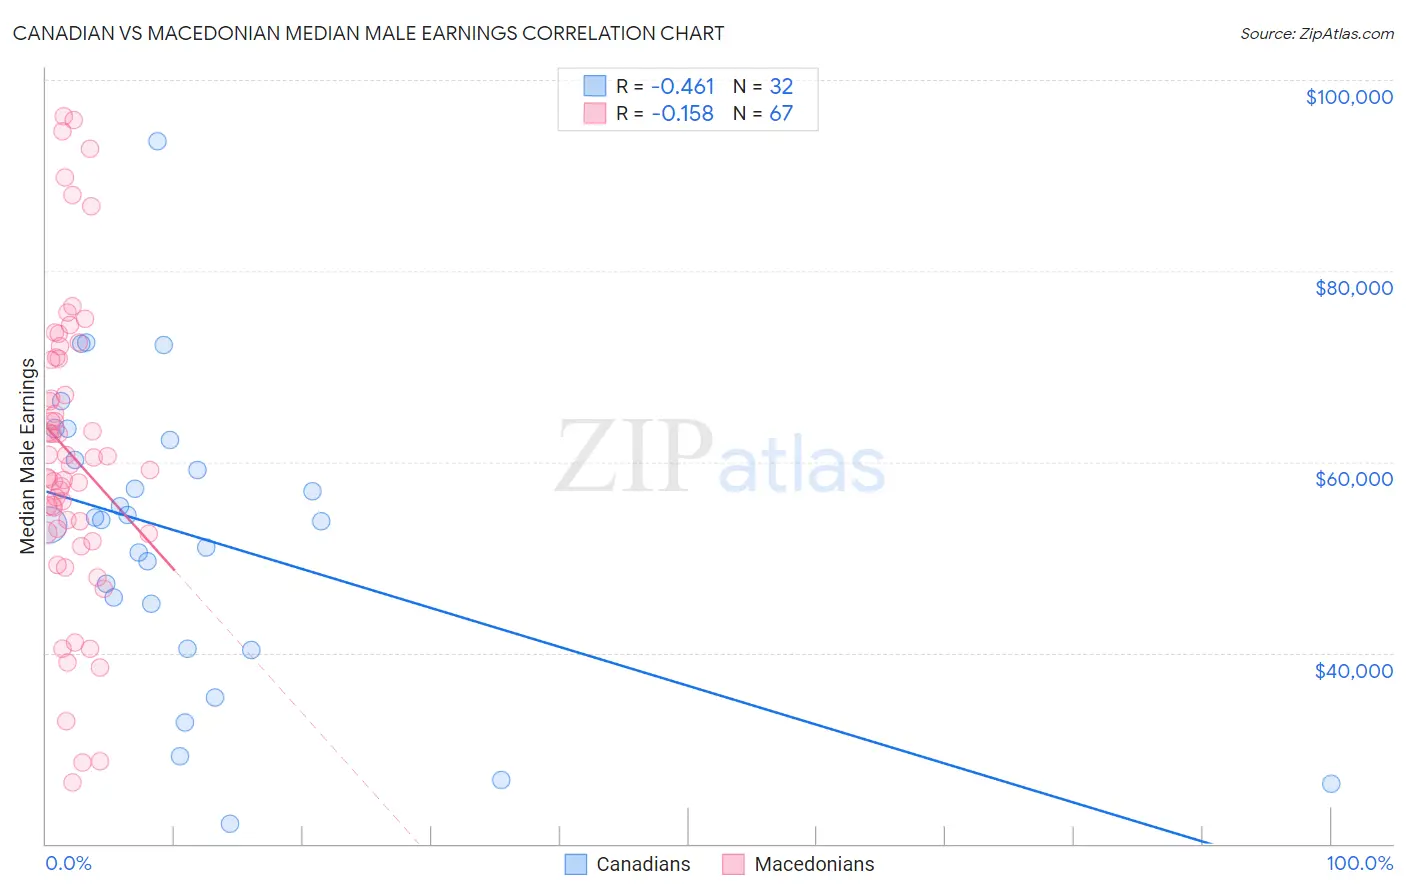
Canadian vs Macedonian Median Male Earnings Correlation Chart
The statistical analysis conducted on geographies consisting of 437,343,758 people shows a moderate negative correlation between the proportion of Canadians and median male earnings in the United States with a correlation coefficient (R) of -0.461 and weighted average of $57,286. Similarly, the statistical analysis conducted on geographies consisting of 132,576,101 people shows a poor negative correlation between the proportion of Macedonians and median male earnings in the United States with a correlation coefficient (R) of -0.158 and weighted average of $59,522, a difference of 3.9%.
Median Male Earnings Correlation Summary
| Measurement | Canadian | Macedonian |
| Minimum | $22,125 | $26,375 |
| Maximum | $93,638 | $96,230 |
| Range | $71,513 | $69,855 |
| Mean | $52,093 | $60,888 |
| Median | $53,822 | $59,610 |
| Interquartile 25% (IQ1) | $42,789 | $52,559 |
| Interquartile 75% (IQ3) | $61,239 | $70,744 |
| Interquartile Range (IQR) | $18,449 | $18,185 |
| Standard Deviation (Sample) | $15,572 | $15,733 |
| Standard Deviation (Population) | $15,327 | $15,615 |
Similar Demographics by Median Male Earnings
Demographics Similar to Canadians by Median Male Earnings
In terms of median male earnings, the demographic groups most similar to Canadians are Arab ($57,298, a difference of 0.020%), Hungarian ($57,309, a difference of 0.040%), Immigrants from Zimbabwe ($57,352, a difference of 0.12%), Immigrants from Albania ($57,179, a difference of 0.19%), and Lebanese ($57,409, a difference of 0.22%).
| Demographics | Rating | Rank | Median Male Earnings |
| Carpatho Rusyns | 95.3 /100 | #113 | Exceptional $57,572 |
| Immigrants | Kuwait | 95.3 /100 | #114 | Exceptional $57,562 |
| Swedes | 94.8 /100 | #115 | Exceptional $57,445 |
| Lebanese | 94.6 /100 | #116 | Exceptional $57,409 |
| Immigrants | Zimbabwe | 94.3 /100 | #117 | Exceptional $57,352 |
| Hungarians | 94.0 /100 | #118 | Exceptional $57,309 |
| Arabs | 94.0 /100 | #119 | Exceptional $57,298 |
| Canadians | 93.9 /100 | #120 | Exceptional $57,286 |
| Immigrants | Albania | 93.3 /100 | #121 | Exceptional $57,179 |
| Immigrants | Jordan | 93.1 /100 | #122 | Exceptional $57,145 |
| Slovenes | 93.1 /100 | #123 | Exceptional $57,145 |
| Chileans | 91.9 /100 | #124 | Exceptional $56,973 |
| Immigrants | Morocco | 91.8 /100 | #125 | Exceptional $56,958 |
| Chinese | 91.1 /100 | #126 | Exceptional $56,872 |
| Brazilians | 90.9 /100 | #127 | Exceptional $56,837 |
Demographics Similar to Macedonians by Median Male Earnings
In terms of median male earnings, the demographic groups most similar to Macedonians are Immigrants from England ($59,527, a difference of 0.010%), Afghan ($59,554, a difference of 0.050%), Italian ($59,551, a difference of 0.050%), Immigrants from Argentina ($59,491, a difference of 0.050%), and Immigrants from Moldova ($59,417, a difference of 0.18%).
| Demographics | Rating | Rank | Median Male Earnings |
| Immigrants | Hungary | 99.5 /100 | #80 | Exceptional $59,806 |
| Ukrainians | 99.4 /100 | #81 | Exceptional $59,728 |
| Croatians | 99.4 /100 | #82 | Exceptional $59,715 |
| Immigrants | Italy | 99.4 /100 | #83 | Exceptional $59,691 |
| Afghans | 99.3 /100 | #84 | Exceptional $59,554 |
| Italians | 99.3 /100 | #85 | Exceptional $59,551 |
| Immigrants | England | 99.3 /100 | #86 | Exceptional $59,527 |
| Macedonians | 99.3 /100 | #87 | Exceptional $59,522 |
| Immigrants | Argentina | 99.3 /100 | #88 | Exceptional $59,491 |
| Immigrants | Moldova | 99.2 /100 | #89 | Exceptional $59,417 |
| Austrians | 99.2 /100 | #90 | Exceptional $59,359 |
| Laotians | 99.2 /100 | #91 | Exceptional $59,351 |
| Immigrants | Kazakhstan | 99.1 /100 | #92 | Exceptional $59,278 |
| Immigrants | Southern Europe | 99.0 /100 | #93 | Exceptional $59,217 |
| Immigrants | North Macedonia | 99.0 /100 | #94 | Exceptional $59,189 |