Immigrants from Singapore vs Immigrants from Sweden Median Male Earnings
COMPARE
Immigrants from Singapore
Immigrants from Sweden
Median Male Earnings
Median Male Earnings Comparison
Immigrants from Singapore
Immigrants from Sweden
$71,348
MEDIAN MALE EARNINGS
100.0/ 100
METRIC RATING
5th/ 347
METRIC RANK
$65,406
MEDIAN MALE EARNINGS
100.0/ 100
METRIC RATING
21st/ 347
METRIC RANK
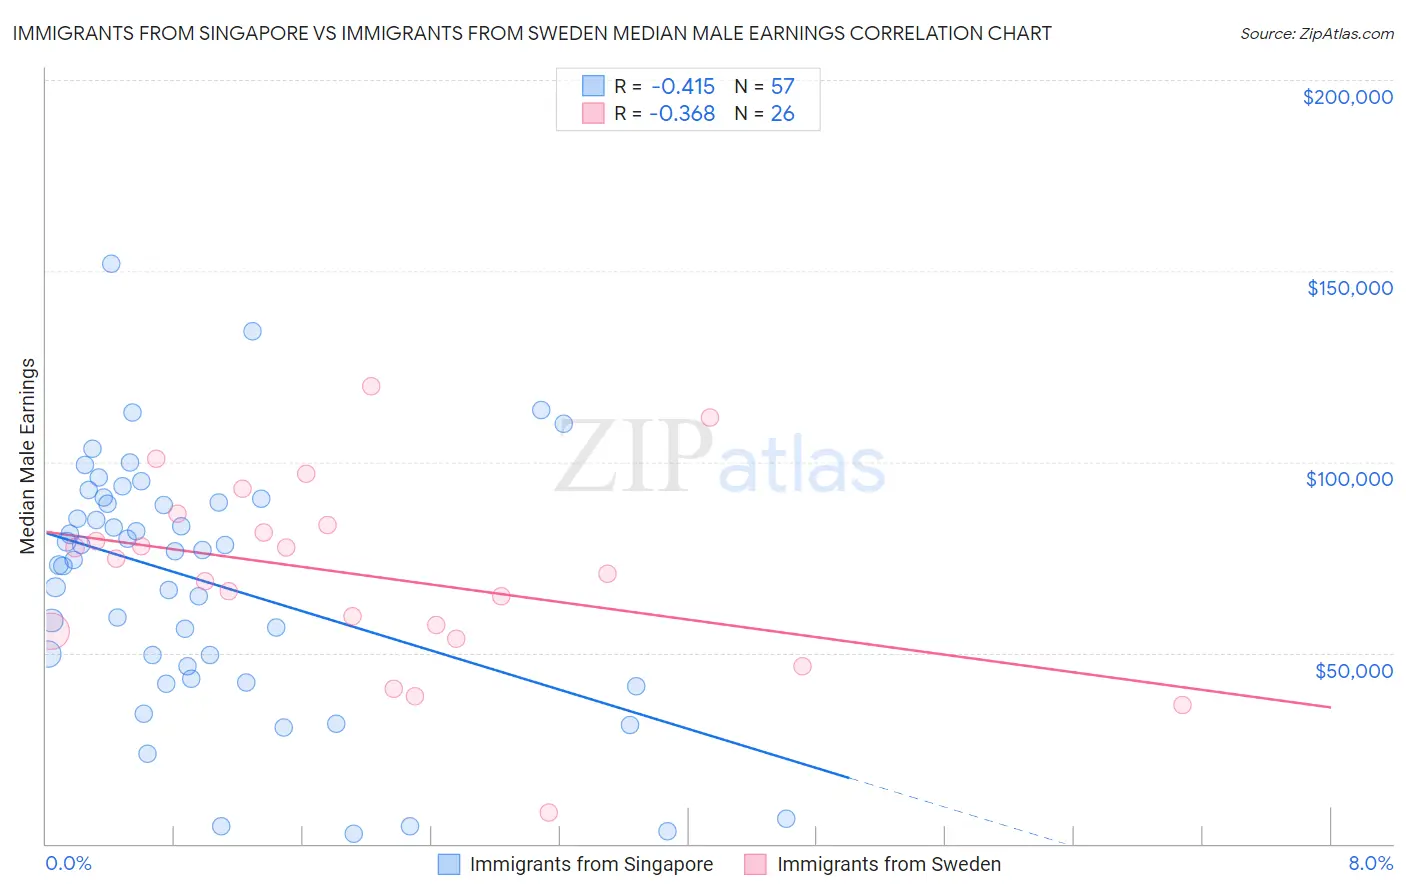
Immigrants from Singapore vs Immigrants from Sweden Median Male Earnings Correlation Chart
The statistical analysis conducted on geographies consisting of 137,517,070 people shows a moderate negative correlation between the proportion of Immigrants from Singapore and median male earnings in the United States with a correlation coefficient (R) of -0.415 and weighted average of $71,348. Similarly, the statistical analysis conducted on geographies consisting of 164,719,286 people shows a mild negative correlation between the proportion of Immigrants from Sweden and median male earnings in the United States with a correlation coefficient (R) of -0.368 and weighted average of $65,406, a difference of 9.1%.
Median Male Earnings Correlation Summary
| Measurement | Immigrants from Singapore | Immigrants from Sweden |
| Minimum | $2,499 | $8,107 |
| Maximum | $151,839 | $119,732 |
| Range | $149,340 | $111,625 |
| Mean | $68,476 | $70,306 |
| Median | $76,629 | $72,770 |
| Interquartile 25% (IQ1) | $44,952 | $55,777 |
| Interquartile 75% (IQ3) | $89,757 | $83,429 |
| Interquartile Range (IQR) | $44,804 | $27,652 |
| Standard Deviation (Sample) | $32,686 | $24,867 |
| Standard Deviation (Population) | $32,398 | $24,384 |
Demographics Similar to Immigrants from Singapore and Immigrants from Sweden by Median Male Earnings
In terms of median male earnings, the demographic groups most similar to Immigrants from Singapore are Iranian ($70,648, a difference of 0.99%), Thai ($72,135, a difference of 1.1%), Immigrants from Hong Kong ($70,146, a difference of 1.7%), Immigrants from Iran ($69,284, a difference of 3.0%), and Immigrants from South Central Asia ($68,960, a difference of 3.5%). Similarly, the demographic groups most similar to Immigrants from Sweden are Immigrants from Japan ($65,518, a difference of 0.17%), Cypriot ($65,549, a difference of 0.22%), Burmese ($65,236, a difference of 0.26%), Immigrants from Korea ($65,079, a difference of 0.50%), and Indian (Asian) ($66,078, a difference of 1.0%).
| Demographics | Rating | Rank | Median Male Earnings |
| Immigrants | Taiwan | 100.0 /100 | #3 | Exceptional $74,031 |
| Thais | 100.0 /100 | #4 | Exceptional $72,135 |
| Immigrants | Singapore | 100.0 /100 | #5 | Exceptional $71,348 |
| Iranians | 100.0 /100 | #6 | Exceptional $70,648 |
| Immigrants | Hong Kong | 100.0 /100 | #7 | Exceptional $70,146 |
| Immigrants | Iran | 100.0 /100 | #8 | Exceptional $69,284 |
| Immigrants | South Central Asia | 100.0 /100 | #9 | Exceptional $68,960 |
| Immigrants | Israel | 100.0 /100 | #10 | Exceptional $68,716 |
| Immigrants | Ireland | 100.0 /100 | #11 | Exceptional $67,698 |
| Immigrants | Australia | 100.0 /100 | #12 | Exceptional $67,634 |
| Immigrants | China | 100.0 /100 | #13 | Exceptional $67,353 |
| Okinawans | 100.0 /100 | #14 | Exceptional $67,232 |
| Immigrants | Eastern Asia | 100.0 /100 | #15 | Exceptional $66,903 |
| Eastern Europeans | 100.0 /100 | #16 | Exceptional $66,472 |
| Immigrants | Belgium | 100.0 /100 | #17 | Exceptional $66,125 |
| Indians (Asian) | 100.0 /100 | #18 | Exceptional $66,078 |
| Cypriots | 100.0 /100 | #19 | Exceptional $65,549 |
| Immigrants | Japan | 100.0 /100 | #20 | Exceptional $65,518 |
| Immigrants | Sweden | 100.0 /100 | #21 | Exceptional $65,406 |
| Burmese | 100.0 /100 | #22 | Exceptional $65,236 |
| Immigrants | Korea | 100.0 /100 | #23 | Exceptional $65,079 |