Bulgarian vs Immigrants from Dominica Median Female Earnings
COMPARE
Bulgarian
Immigrants from Dominica
Median Female Earnings
Median Female Earnings Comparison
Bulgarians
Immigrants from Dominica
$43,638
MEDIAN FEMALE EARNINGS
100.0/ 100
METRIC RATING
43rd/ 347
METRIC RANK
$37,825
MEDIAN FEMALE EARNINGS
2.0/ 100
METRIC RATING
252nd/ 347
METRIC RANK
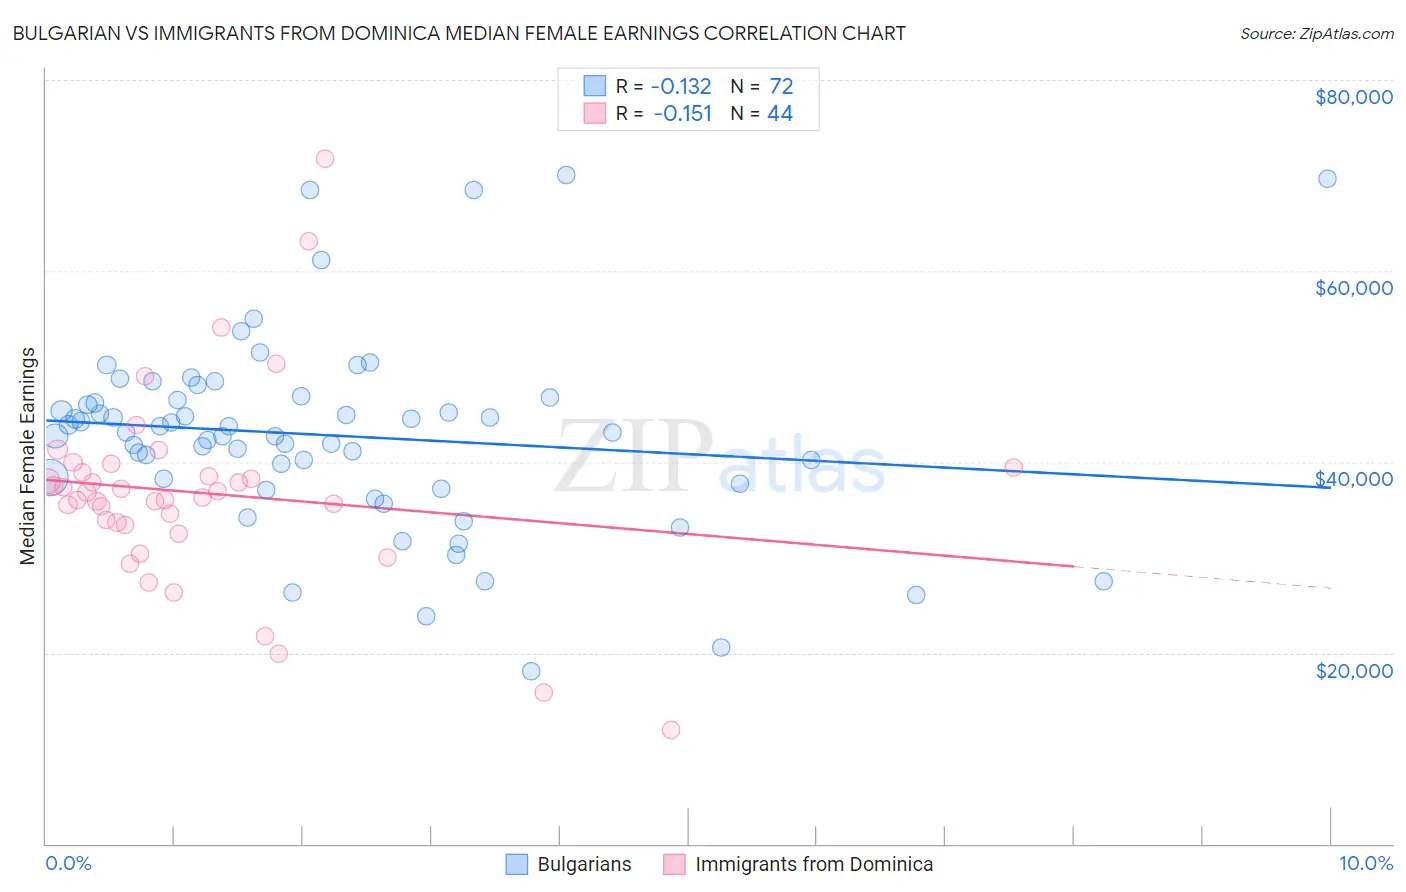
Bulgarian vs Immigrants from Dominica Median Female Earnings Correlation Chart
The statistical analysis conducted on geographies consisting of 205,601,132 people shows a poor negative correlation between the proportion of Bulgarians and median female earnings in the United States with a correlation coefficient (R) of -0.132 and weighted average of $43,638. Similarly, the statistical analysis conducted on geographies consisting of 83,795,110 people shows a poor negative correlation between the proportion of Immigrants from Dominica and median female earnings in the United States with a correlation coefficient (R) of -0.151 and weighted average of $37,825, a difference of 15.4%.
Median Female Earnings Correlation Summary
| Measurement | Bulgarian | Immigrants from Dominica |
| Minimum | $18,066 | $11,953 |
| Maximum | $70,060 | $71,750 |
| Range | $51,994 | $59,797 |
| Mean | $42,770 | $36,730 |
| Median | $43,122 | $36,530 |
| Interquartile 25% (IQ1) | $37,998 | $33,522 |
| Interquartile 75% (IQ3) | $46,606 | $39,104 |
| Interquartile Range (IQR) | $8,608 | $5,583 |
| Standard Deviation (Sample) | $10,148 | $10,397 |
| Standard Deviation (Population) | $10,078 | $10,278 |
Similar Demographics by Median Female Earnings
Demographics Similar to Bulgarians by Median Female Earnings
In terms of median female earnings, the demographic groups most similar to Bulgarians are Bhutanese ($43,648, a difference of 0.020%), Immigrants from Denmark ($43,646, a difference of 0.020%), Immigrants from Czechoslovakia ($43,571, a difference of 0.15%), Immigrants from Europe ($43,523, a difference of 0.26%), and Immigrants from Bolivia ($43,467, a difference of 0.39%).
| Demographics | Rating | Rank | Median Female Earnings |
| Immigrants | Turkey | 100.0 /100 | #36 | Exceptional $44,066 |
| Immigrants | Switzerland | 100.0 /100 | #37 | Exceptional $43,996 |
| Latvians | 100.0 /100 | #38 | Exceptional $43,941 |
| Israelis | 100.0 /100 | #39 | Exceptional $43,852 |
| Immigrants | Malaysia | 100.0 /100 | #40 | Exceptional $43,835 |
| Bhutanese | 100.0 /100 | #41 | Exceptional $43,648 |
| Immigrants | Denmark | 100.0 /100 | #42 | Exceptional $43,646 |
| Bulgarians | 100.0 /100 | #43 | Exceptional $43,638 |
| Immigrants | Czechoslovakia | 100.0 /100 | #44 | Exceptional $43,571 |
| Immigrants | Europe | 100.0 /100 | #45 | Exceptional $43,523 |
| Immigrants | Bolivia | 100.0 /100 | #46 | Exceptional $43,467 |
| Bolivians | 100.0 /100 | #47 | Exceptional $43,445 |
| Immigrants | Indonesia | 100.0 /100 | #48 | Exceptional $43,412 |
| Immigrants | Serbia | 100.0 /100 | #49 | Exceptional $43,385 |
| Immigrants | Uzbekistan | 100.0 /100 | #50 | Exceptional $43,363 |
Demographics Similar to Immigrants from Dominica by Median Female Earnings
In terms of median female earnings, the demographic groups most similar to Immigrants from Dominica are Welsh ($37,856, a difference of 0.080%), Immigrants from Iraq ($37,864, a difference of 0.10%), Alaskan Athabascan ($37,905, a difference of 0.21%), Swiss ($37,904, a difference of 0.21%), and Immigrants from Somalia ($37,914, a difference of 0.23%).
| Demographics | Rating | Rank | Median Female Earnings |
| Immigrants | Middle Africa | 2.7 /100 | #245 | Tragic $37,965 |
| Delaware | 2.6 /100 | #246 | Tragic $37,964 |
| Immigrants | Somalia | 2.4 /100 | #247 | Tragic $37,914 |
| Alaskan Athabascans | 2.3 /100 | #248 | Tragic $37,905 |
| Swiss | 2.3 /100 | #249 | Tragic $37,904 |
| Immigrants | Iraq | 2.2 /100 | #250 | Tragic $37,864 |
| Welsh | 2.1 /100 | #251 | Tragic $37,856 |
| Immigrants | Dominica | 2.0 /100 | #252 | Tragic $37,825 |
| Danes | 1.6 /100 | #253 | Tragic $37,730 |
| Whites/Caucasians | 1.1 /100 | #254 | Tragic $37,531 |
| Colville | 1.1 /100 | #255 | Tragic $37,514 |
| Samoans | 1.0 /100 | #256 | Tragic $37,498 |
| Hawaiians | 1.0 /100 | #257 | Tragic $37,497 |
| Belizeans | 0.9 /100 | #258 | Tragic $37,429 |
| Scotch-Irish | 0.8 /100 | #259 | Tragic $37,383 |