Bulgarian vs Peruvian Median Female Earnings
COMPARE
Bulgarian
Peruvian
Median Female Earnings
Median Female Earnings Comparison
Bulgarians
Peruvians
$43,638
MEDIAN FEMALE EARNINGS
100.0/ 100
METRIC RATING
43rd/ 347
METRIC RANK
$40,234
MEDIAN FEMALE EARNINGS
75.3/ 100
METRIC RATING
156th/ 347
METRIC RANK
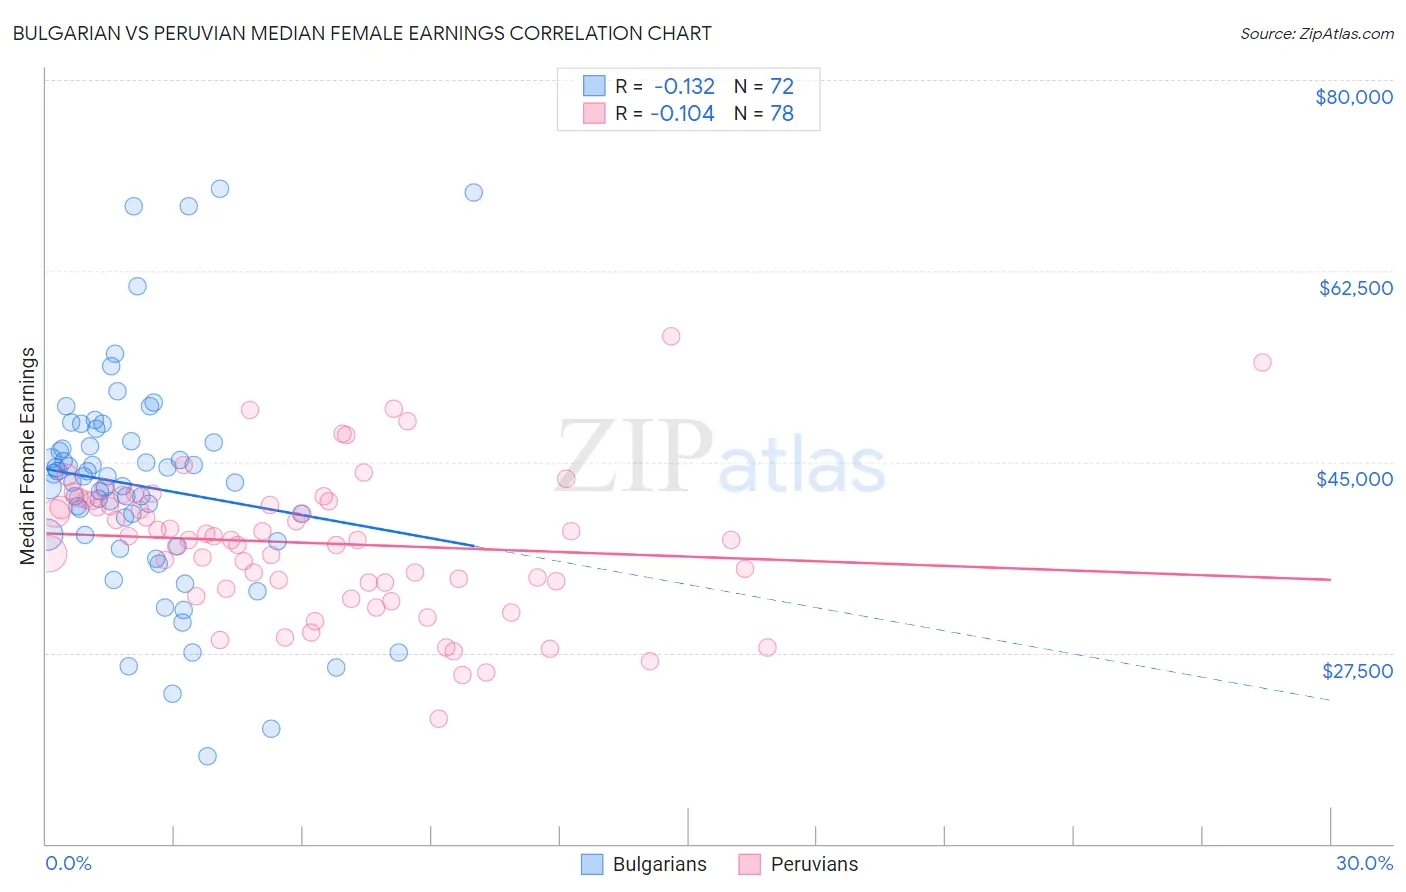
Bulgarian vs Peruvian Median Female Earnings Correlation Chart
The statistical analysis conducted on geographies consisting of 205,601,132 people shows a poor negative correlation between the proportion of Bulgarians and median female earnings in the United States with a correlation coefficient (R) of -0.132 and weighted average of $43,638. Similarly, the statistical analysis conducted on geographies consisting of 363,169,099 people shows a poor negative correlation between the proportion of Peruvians and median female earnings in the United States with a correlation coefficient (R) of -0.104 and weighted average of $40,234, a difference of 8.5%.
Median Female Earnings Correlation Summary
| Measurement | Bulgarian | Peruvian |
| Minimum | $18,066 | $21,456 |
| Maximum | $70,060 | $56,528 |
| Range | $51,994 | $35,072 |
| Mean | $42,770 | $37,547 |
| Median | $43,122 | $37,836 |
| Interquartile 25% (IQ1) | $37,998 | $33,920 |
| Interquartile 75% (IQ3) | $46,606 | $41,414 |
| Interquartile Range (IQR) | $8,608 | $7,494 |
| Standard Deviation (Sample) | $10,148 | $6,584 |
| Standard Deviation (Population) | $10,078 | $6,542 |
Similar Demographics by Median Female Earnings
Demographics Similar to Bulgarians by Median Female Earnings
In terms of median female earnings, the demographic groups most similar to Bulgarians are Bhutanese ($43,648, a difference of 0.020%), Immigrants from Denmark ($43,646, a difference of 0.020%), Immigrants from Czechoslovakia ($43,571, a difference of 0.15%), Immigrants from Europe ($43,523, a difference of 0.26%), and Immigrants from Bolivia ($43,467, a difference of 0.39%).
| Demographics | Rating | Rank | Median Female Earnings |
| Immigrants | Turkey | 100.0 /100 | #36 | Exceptional $44,066 |
| Immigrants | Switzerland | 100.0 /100 | #37 | Exceptional $43,996 |
| Latvians | 100.0 /100 | #38 | Exceptional $43,941 |
| Israelis | 100.0 /100 | #39 | Exceptional $43,852 |
| Immigrants | Malaysia | 100.0 /100 | #40 | Exceptional $43,835 |
| Bhutanese | 100.0 /100 | #41 | Exceptional $43,648 |
| Immigrants | Denmark | 100.0 /100 | #42 | Exceptional $43,646 |
| Bulgarians | 100.0 /100 | #43 | Exceptional $43,638 |
| Immigrants | Czechoslovakia | 100.0 /100 | #44 | Exceptional $43,571 |
| Immigrants | Europe | 100.0 /100 | #45 | Exceptional $43,523 |
| Immigrants | Bolivia | 100.0 /100 | #46 | Exceptional $43,467 |
| Bolivians | 100.0 /100 | #47 | Exceptional $43,445 |
| Immigrants | Indonesia | 100.0 /100 | #48 | Exceptional $43,412 |
| Immigrants | Serbia | 100.0 /100 | #49 | Exceptional $43,385 |
| Immigrants | Uzbekistan | 100.0 /100 | #50 | Exceptional $43,363 |
Demographics Similar to Peruvians by Median Female Earnings
In terms of median female earnings, the demographic groups most similar to Peruvians are Immigrants from Africa ($40,257, a difference of 0.060%), Portuguese ($40,177, a difference of 0.14%), British West Indian ($40,299, a difference of 0.16%), Immigrants from Oceania ($40,297, a difference of 0.16%), and Immigrants from Senegal ($40,157, a difference of 0.19%).
| Demographics | Rating | Rank | Median Female Earnings |
| Immigrants | Cameroon | 79.7 /100 | #149 | Good $40,354 |
| Immigrants | Chile | 79.6 /100 | #150 | Good $40,353 |
| Immigrants | Armenia | 79.2 /100 | #151 | Good $40,340 |
| West Indians | 78.4 /100 | #152 | Good $40,317 |
| British West Indians | 77.7 /100 | #153 | Good $40,299 |
| Immigrants | Oceania | 77.6 /100 | #154 | Good $40,297 |
| Immigrants | Africa | 76.2 /100 | #155 | Good $40,257 |
| Peruvians | 75.3 /100 | #156 | Good $40,234 |
| Portuguese | 73.0 /100 | #157 | Good $40,177 |
| Immigrants | Senegal | 72.2 /100 | #158 | Good $40,157 |
| Immigrants | Vietnam | 72.0 /100 | #159 | Good $40,153 |
| Inupiat | 68.9 /100 | #160 | Good $40,080 |
| Alsatians | 68.0 /100 | #161 | Good $40,060 |
| South American Indians | 66.1 /100 | #162 | Good $40,019 |
| Lebanese | 65.5 /100 | #163 | Good $40,006 |